Your Dashboard Shows Green.Your Factory Is Red.Here's the Real Problem.
Introduction
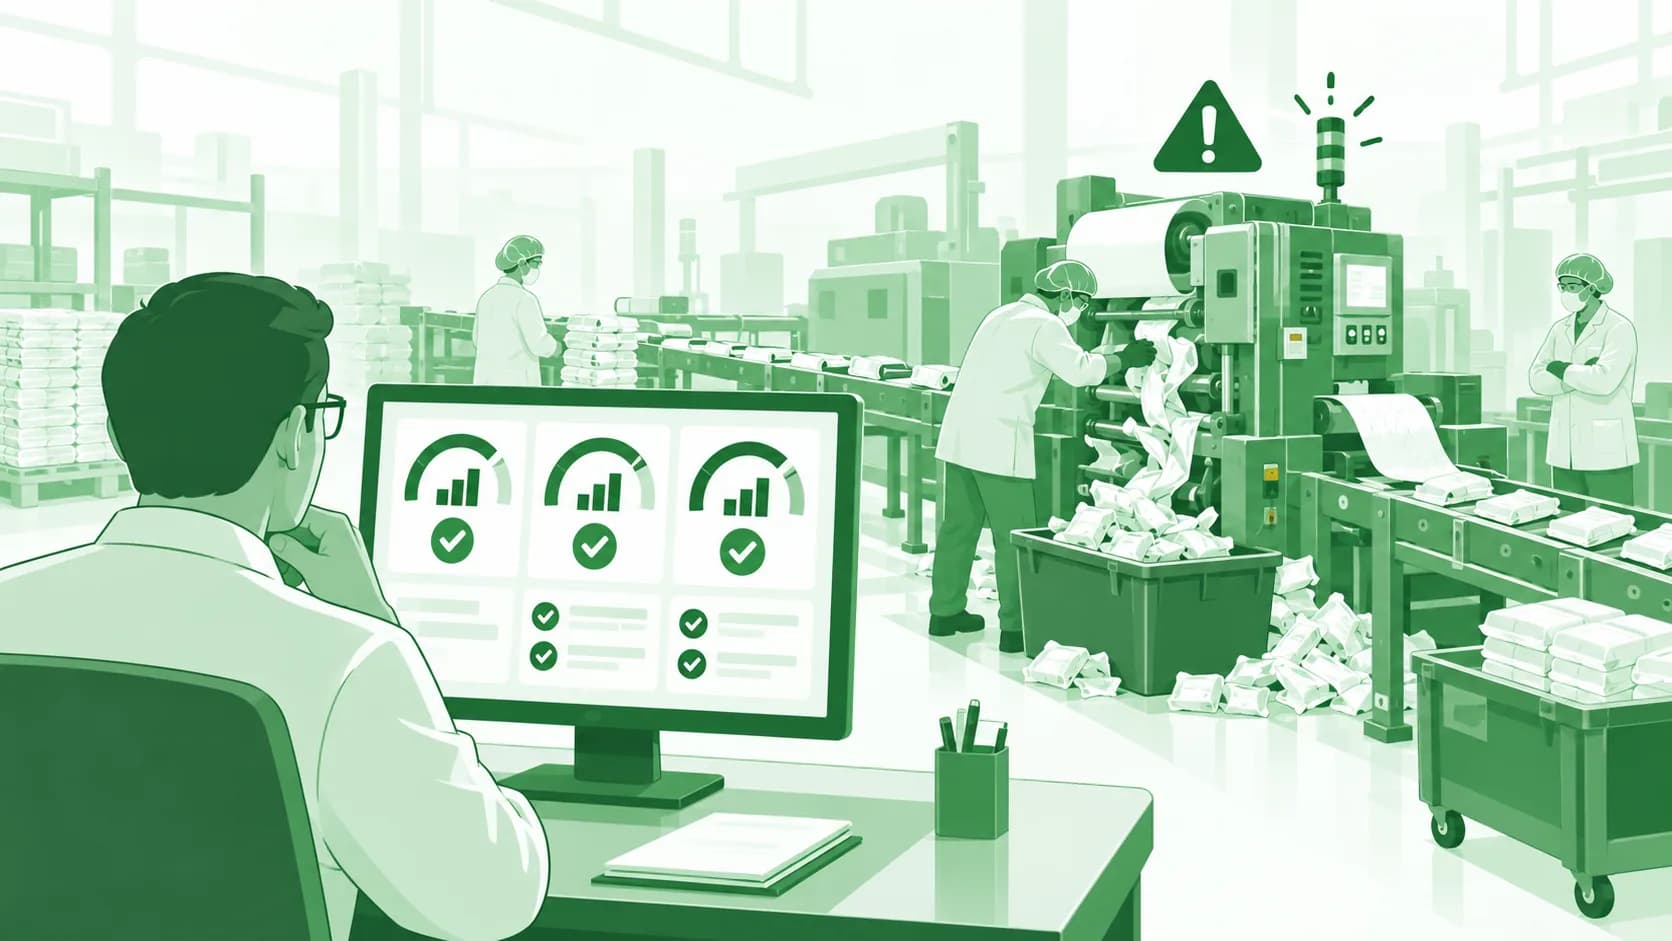
Your dashboard tells you everything is under control: OEE above 80%, OTIF consistently high, downtime manageable.
But your operations tell a different story: dispatches delayed, teams firefighting daily, customers following up more frequently.
Both cannot be true.
The Misdiagnosis
Most organizations believe better dashboards lead to better decisions, so they invest in BI tools, reporting systems, and KPI tracking.
But performance does not improve because dashboards do not fail. The data behind them does.
The Business Impact
When leadership relies on distorted data, interventions are delayed and priorities drift.
A 10-15% gap in reported vs actual performance can translate into 20-30% hidden capacity loss. That is revenue never realized.
- Delayed interventions because issues are hidden
- Wrong priorities due to misleading performance signals
- Lost capacity masked under inflated OEE numbers
- Customer dissatisfaction despite strong metrics
The Gemba Visibility Gap Model™
To fix this, diagnose where visibility breaks.
- Data Integrity Gap: Manual entries, delayed updates, or intentional adjustments distort reality.
- Definition Gap: Different teams interpret KPIs differently; OEE is not calculated consistently.
- Frequency Gap: Data is reported end-of-shift or end-of-day, not when action is needed.
- Action Gap: Insights exist, but no structured response follows.
How to Apply This Immediately
Challenge your current system with direct questions and look for reporting comfort patterns.
- How real-time is your operational data?
- Can supervisors challenge reported numbers confidently?
- Is every KPI linked to a defined action trigger?
- Heavy dependence on Excel for daily reporting
- End-of-day metric corrections
- Operational surprises despite green dashboards
Ground Reality: Where Control Actually Comes From
Dashboards create visibility. They do not create control.
Control comes from timely decisions, accurate data, and ground-level ownership.
On the shopfloor, you see micro-stoppages not recorded, delays normalized by teams, and workarounds that never reach reports.
These gaps define performance.
The Pattern Across Organizations
High-performing plants do not rely on dashboards alone. They rely on real-time signals, supervisor ownership, and immediate corrective action.
Low-performing plants rely on retrospective reporting, aggregated metrics, and delayed reviews.
The difference is not technology. The difference is truth vs reporting.
Gemba Takeaway
If your data looks consistently perfect, your system is likely hiding problems.
Operational excellence does not come from better dashboards. It comes from better data integrity, faster action cycles, and stronger ground-level visibility.
You do not need more reports. You need closer reality.
Facing similar gaps between strategy and execution? Let's talk: sales@gembaconcepts.com / https://gembaconcepts.com/
Key Takeaways
- 01
Dashboards do not fail; distorted and delayed data does.
- 02
Control comes from accurate data, timely decisions, and ground ownership.
- 03
You do not need more reports; you need closer reality.
Continue Reading
How to Improve Production Planning and Reduce WIP in Printing & Packaging Manufacturing
Printed sheets waiting for lamination, laminated reels waiting for slitting, die-cut blanks waiting for gluing. Everything's moving. Nothing's finishing.
How to Prevent Raw Material Shortages and Production Delays in Printing & Packaging Manufacturing
The press is ready. The job is scheduled. The customer is waiting — and the board hasn't arrived. What looks like a raw material shortage is often a visibility or planning problem in disguise.
How to Reduce Scrap, Material Waste and Rework in Personal Hygiene Manufacturing
Nonwoven trimmings. SAP overshoot. Wet wipes rejected for saturation variance. Every one is material that was paid for, processed, sometimes packed, and then written off.
Industrial Businesses Across 3 Continents