Single minute exchange of die

In this blog we will be learning about SMED and how to implement it.
The basic principle of Lean manufacturing is to increase the competitiveness of
companies by reducing costs. This philosophy seeks to get as close to the optimum as
possible, that is, to spend only what is indispensable of what adds value to the product.
In this sense the Lean manufacturing simply intends to remove all the possible waste.
The principles of Lean are all focused on process improvement, which ultimately leads
to improved efficiency and this leads to higher profitability. One of the building blocks of
Lean relates to the rapid setup. The faster the setup times, the less equipment
downtime since waiting is part of the seven Muda (waste) of a production environment.

What is SMED

SMED is a set of techniques belonging to Lean manufacturing that aim to reduce the
setup time of a machine. When properly applied, it allows machines to take less time to
attach, giving more flexibility to the line.
SMED, also known as Quick Changeover of Tools, can be applied in any industrial unit
and to any machine. It is defined as the minimum amount of time necessary to change
the type of production activity. Thus, it takes into consideration the moment in which the
last piece of a previous lot was produced vis-à-vis the first piece produced by the
subsequent lot (Shingo, 1985).

Why the SMED is required?

From the above example we can see that when our lot size increases, production to
operation time ratio decreases. But in this highly competitive market era every company
wants to increase the variety of products and wants to minimize the lot size as much as
possible.
So, for the small lot size it is necessary that the die changeover time should be not high
other wise it effects the production time and the cost of the product.

Steps in SMED

  • Observing and Recording.
  • Separation between internal and external tasks.
    • Internal tasks: activities performed during the change operation while the
      machine is in downtime.
    • External Tasks: activities performed before the change operation, not made in the downtime period.
  • Converting the maximum number of internal tasks into external tasks. Streamlining all the possible tasks.
  • Documenting internal and external procedures.

Phases in SMED

10 steps to choosing a warehouse management system

Aside

Choosing the right warehouse management system can often be as simple as taking a few considerations into account:

Step 1. Understand your current systems

If you are already using software to manage your warehouse operations or part of your warehouse operations, then you should start by looking at it in detail. What functions does it have that you like? What functions does it not have that you want?

You will also need to know what integrations you require from your warehouse management system. For example, you may require it to integrate it with your shipping carriers or sales channels.

Step 2. Decide if your picking process requires a WMS

If you are running a very small ecommerce operation, like a side-hustle, a WMS is unlikely to be necessary. But, if you are moving any reasonable number of products or you have any ambitions to scale you will need a more sophisticated solution.

Step 3. Understand what you are looking for in a warehouse management system

This is where you make your checklist of ‘must-haves’ and ‘like-to-haves’. You can then compare this list against your options.

Step 4. Decide on your budget

Of course, good warehouse management systems will cost money. So you will need to know how much money you can commit from your cash flow to purchasing one.

Step 5. Create a shortlist

There will be a few different options you can choose from. The easiest way to decide which ones to shortlist is simply to create a list or spreadsheet listing prices and features.

Once you have created a shortlist you can then go and use free trials or book demos with those you think are right for you.

Step 6. Check it integrates with your entire fulfillment process

Warehouse management is only part of the puzzle of ecommerce. Your WMS should also connect with your inventory management system and shipping carriers.

Step 7. Check it gives you the reports your need

A good warehouse management system will give you reports that can make definite improvements to your business. It should provide these reports in an easily accessible way.

It’s also good if the WMS provides demand forecasting as this will help prevent under and overstocking in the future.

Step 8.  Check it works with your ecommerce tech-stack

You probably use a range of platforms, marketplaces, sales channels and shipping carriers. You need to check that your warehouse management system either has a native integration, seamless workaround or open API to do this.

This is where you can make use of a free trial. As it’s hard to know if a system works for you without testing it out.

Step 9. Is it easy for pickers to use and understand?

A good WMS will be easy for your pickers and warehouse team to understand and use. While there will always be a training period with any new software, you should look for an intuitive interface and easy-to-understand processes. This will make it easier for your team to pick up the new system and cut down on training time for new hires.

Step 10. Does it come with support?

Your business will be unique, therefore it’s important that any service you purchase comes with support. This support will be able to help you through any issues that arise with the product.


Article by:- Akshay Patel

Capacity Planning for Manufacturing

In this blog we will be learning the basics of capacity planning and how to do it, With help of this you can perform capacity analysis for any manufacturing facility. So let’s get in to details of it.

What is capacity?

As name suggests capacity is the maximum amount that something can contain or produce, in manufacturing terms we can say that capacity is ability to manufacture a particular quantity of products in a particular duration of time.

So what about the planning

Capacity planning is basically an analysis done to check whether a manufacturing plant can produce a particular no of products in a given period, with available no of resources.

The capacity is calculated over days or weeks or months. The measurement is done in a way that we can adjust our production capacity according to the demand from the market.

Normally capacity planning is done on machines or equipment. There will be two outcome of this analysis; either there is capacity or numbers.

If want to take in to consider the number, then we can tell how much more machines to be required to fulfil the demand.

Calculation of Machine hour Capacity

Our first step is to understand and calculate the capacity of the machine hour in the factory. For an example if a factory has 200 machines, and the workers in the factory utilize the machine from 8 am to 6 pm for 10 hours a day, then the capacity would be 10 multiplied by 200, which comes to 2000 machine hours.

Production capacity with a single product

1st step to calculate capacity with single product is to determine time to produce a single product, and then it is divided by the plant capacity in hours.

For example, if one worker takes 40 minutes (0.66hrs) on a machine to make one product and the capacity of the machine has 2000 hours, then the production capacity would be

2000 / 0.66, then this would be 3003 units per day

How to do capacity planning

For better understanding let’s see an example

Suppose manufacturing plants needs to produce 100 units per day and we need to do capacity analysis

And if this product requires two operations A and B and its standard times are 5 minutes and 10 minutes respectively.

So the standard times are calculated by a method called time study.

And also operation A and B use two machines X and Y respectively. And presently have one each.

Standard working time of this plant is 420 minutes per shift breaks are excluded and this plant operates three shifts per day.

Also on an average 30 minutes is required for both machines for maintenance or we can say for down time, change overs, etc.

Suppose 98% is the yield of the both machines. Also these two machines is only able to run at 85% efficiency of its standard speed, if we take in to consideration of minor stoppages.

So let’s calculate.

Considering the minor speed loss, cycle time per product for both machines will be 5/(0.85) and 10/(0.85) minutes, respectively.

This is 5.88 and 11.76 respectively.

Also since yield for these machines is 98%, to produce 2% more of the demand, which is, 100 x 1.02 = 108

Now let’s calculate load on each machines.

  1. Calculate load of the machine X…

This is equal to demand per shift x cycle time

= (108/3) x 5.88

= 211.68 minutes.

  1. Calculate load of the machine Y…

This is equal to demand per shift x cycle time

= (108/3) x 11.76

= 423.36 minutes.

Now let’s calculate no of each machine required for meeting the demand.

No of the machine = Load per shift / Available time per shift per machine.

= 211.68 / (420 – 30)

= 0.54

This is one machine. And we have enough capacity for doing the operation A. No need to worry.

Now let’s check the capacity for operation B.

No of the machine = Load per shift / Available time per shift per machine.

= 432.36 / (420- 30)

= 1.11

So we require two machines for doing operation B.

We can conclude that there is a capacity issue. We only have one machine for doing operation B and we need one more.

This is how the capacity planning is been done


Article By – Shivank Kumar Choubey


KRA/KPI – The way of measuring your business

Aside

When it comes to measuring success, then KPI and KRA are two key measurable values that help business owners to measure their success and progress. 

Measuring growth and goals is considered one of the most important activities of a business. Measuring and tracking success is important because it gives you a clear picture of your journey: Where you are right now, where you are going, how soon can you reach it, and who will help you reach your destination.

Businesses that don’t measure the growth and performance of their employees are often diverted from their primary goals and end up wasting time and resources which could otherwise have been utilized for their success. When it comes to measuring success, then KPI and KRA are two key measurable values that help business owners to gauge their success and progress. KRA is Key Result Area or also known as the Key Responsibility Area and KPI is Key Performance Indicators.

We will share the key performance indicators for employees, and the difference between KPI and KRA, which every business owner should be aware of.

But first, let’s understand these terms: What is KPI and KRA? 

What is KPI or Key Performance Indicators?

KPIs are quantifiable and measurable values, which are used to evaluate and measure the success of a company or employees. Depending upon the business objectives, KPIs for different companies and organizations can be different, and unique.

For example, KPIs for a manufacturing firm can be daily production count and utilization resources. At the same time, KPIs for a cinema theatre can be customer satisfaction and the number of non-empty seats in the auditorium at any given time.

What is KRA or Key Responsibility Area?

KRA or Key Responsibility Area are quantifiable and measurable tasks and responsibilities for employees in an organization. Depending on the job profile, experience and expectations, different employees can have different KRAs within the same company.

For example, KRA for a sales manager can be the total number of sales in a quarter, while KRA for an HR Manager can be attrition rate and employee satisfaction.

Difference Between KPI and KRA

Types of Key Performance Indicators

When it comes to an organization, then profit is the most critical metric to gauge the success or failure, over a period of time.

Against this backdrop, the key performance indicators for an organization are:
  1. Revenue Growth: Tracking revenues from one period of time to the other is an important metric to monitor, and thus, included in the list of key performance indicators for the company.
  2. Income Sources: Companies can calculate revenue per client, revenues per unit of product sold, and more to find out the true picture of the growth of a company.
  3. Profitability Over Time: What is the profitability ratio over time, vis-a-vis revenues and expenses. If profitability is reduced, then how can you increase it? Should cost-cutting be a solution?
  4. Working Capital: Working capital is the funds needed to carry on the day-to-day activities and business operations of a company.
Key Performance Indicators for Employees

When it comes to finding out the key performance indicators for employees, then these factors can be considered, depending on the business objectives and goals:

  • Customer Service
  • Communication
  • Job Departments
  • Teamwork
  • Performance of individual

To find out the right metrics, and to start monitoring them, you need expert guidance from someone (Consultants) who has working history with employees, organizations, projects and optimized them as well.


Article by Ravi Nashit.

Total Quality Management (TQM)

Aside

Let us first understand what is TQM and after that we will look into its 4 major pillars which helps us in TQM for achieving desired results.

Total = Made up of the whole.
Quality = Degree of excellence of a product or service provides.
Management = Art of Planning, Organizing, Controlling etc.

TQM can be further divided into 3 parts as follows

System = All persons of all divisions at every stratum.
Method = In methods there are different tools and methods which are used to
achieve desired result such as Kaizen, QC Circle, 5S, TPM, MSA, OEE etc.
Purpose = Purpose can be any of the following from (QCDSME).
▪ Q: Quality improvement
▪ C: Cost reduction
▪ D: Delivery execution
▪ S: Safety maintenance
▪ M: Morale boosting
▪ E: Environmental protection

TQM can be defined as a management approach for an organization, centred on quality, based on the participation of all its members and aiming at long-term success through customer satisfaction, and benefits to all members of the organization and to society. And the main motive of TQM is to “Do the right things right the first time, every time”

❖ 4 Pillars of TQM

  1. Customer Focus: Studying customer needs, gathering customer requirements, and measuring and managing customer satisfaction. Customer satisfaction is seen as the company’s highest priority. The company believes that it will only be successful if its customers are satisfied.
  2. Process Management: Develop a production process that reduce the product variations. Applying the same process; the same product should be produces with the same level of quality every time. Teams are process-oriented, and interact with their internal customers to deliver the required results. Management’s focus is on controlling the overall process, and rewarding teamwork.
  3. Employee Empowerment: TQM environment requires a committed and well trained work force that participates fully in quality improvement activities. Ongoing education and training of all employees supports the drive for quality.
  4. Continuous Improvement: TQM recognizes that product quality is the result of process quality. As a result, there is a focus on continuous improvement of the company’s processes. This will lead to an improvement in process quality. In turn this will lead to an improvement in product quality. Measurement and analysis id the tool that has been used for that


Article By.

Dhavalkumar Gohel

5S An Opportunity

Aside

5S is a methodology that helps in organizing our workplace and ensures that work is performed efficiently, effectively and more importantly in a safe environment. This helps in making our work environment secure, non- hazardous and improves communication and discipline between the workers.

5S consists of 5 terms that define the whole methodology of this process.


1S – Seiri(Sorting)

This term involves sorting out the required and non- required items of our workplace. After this Red tags are assigned to the periodically used or non-required items and a separate place is allotted to the Red Tag material called as Red tag area. This helps in improving the space utilization and also results in monetary

2S – Seiton(Set in Order)

According to this term “Everything must have its place and Everything must be at its place”. In this process we define and fix the layout of the work area and arrange everything in order that reduces search time/waiting time, helps in faster movement

3S – Seiso(Shine)

This term means to keep our working environment clean. This helps to detect leakages if any, provides a hygienic and safe working environment and improves working efficiency. It involves of providing cleaning check lists, CLIT checklists etc. to ensure cleaning action is being carried out regularly and timely.

4S – Seiketsu (Standardize)

In this method Standard Operating Procedures (SOPs) are created for more visual display, engagement of the It helps to assign regular tasks, create schedules and enforce instructions so that the activities become daily life routine. It helps in uniform implementation of 1S, 2S and 3S in the organization.

5S – Shitsuke (Sustain)

Sustain means to ensure discipline throughout the implementation of 5S. It is the centre of the whole 5S process and unless it is carried out perfectly by the work force of the organization 5S cannot be implemented. It involves keeping a record of the improvement and analyse the loop holes for which 5S is not getting implemented. Here a 5S audit is done and score is provided to each zone that helps to understand where the particular organization or area stands in terms of 5S.


Article by

Taksh Agarwal

Top 24 Warehouse KPIs

Aside

TOP 24 WAREHOUSE KPIS

Receiving

Among the most critical warehouse KPIs are the metrics that measure receiving performance. Warehouse operations begin with this process, and any inefficiencies here will snowball through all the subsequent processes.

Warehouse KPI metrics that correspond to the receiving process are:

1. Cost of Receiving Per Receiving Line:

The expense that the warehouse incurs on the receiving process of each receiving line. This includes handling costs as well.

2. Receiving Productivity:

Determined in terms of labour by measuring the volume of goods received per warehouse clerk per hour.

3. Receiving Accuracy:

Percentage of accurate receipts, i.e., the proportion of correctly received orders against purchase orders.

4. Dock Door Utilization:

Percentage of how many of the total dock doors were utilized.

5. Receiving Cycle Time:

The time taken to process each receipt.

These warehouse KPIs help managers identify any lapses in receiving and avoid a chain reaction of inefficiencies down the process line.

Catching inefficiencies, such as a long receiving cycle caused by busy dock doors, can reduce deficiencies as early as in the receiving stage.

Putaway

Once goods are received, the process of putaway begins with placing each item at a designated location selected for most convenient retrieval.

Effective putaway ensures a smooth picking process, thus significantly reducing lead time.

Here are some of the important warehouse KPIs that you must track to measure the efficiency of the putaway process:

6. Putaway Cost Per Line:

Expenses incurred for putting away stock per line, including labor, handling, and equipment costs.

7. Putaway Productivity:

Volume of stock put away per warehouse clerk per hour.

8. Putaway Accuracy:

Percentage of number of items put away accurately at the designated location.

9. Labor and Equipment Utilization:

Percentage of the labor and material handling equipment utilized during the put-away process.

10. Putaway Cycle Time:

Total time taken during the entire process of each put-away task.

Evaluating the putaway through these warehouse KPIs gives you a clear picture of potential inefficiencies in the process. Recognizing snags such as inaccuracies or scarcity of labor will help you to optimize and streamline the process.

Storage

Whether your warehouse is dependent on storing goods manually or uses AS/RS (Automated Storage and Retrieval System), you still need to measure efficiency. Here are some important warehouse KPIs to measure storage efficiency:

11. Carrying Cost of Inventory: 

The cost of storage over a particular span of time, including the cost of inventory, capital costs, service costs, damage costs, and costs of obsolescence. The longer the stock stays in storage, the higher the cost to the warehouse.

12. Storage Productivity:

Volume of inventory stored per square foot.

13. Space Utilization:

Percentage of space occupied by inventory out of the total space available for storage.

14. Inventory Turnover:

The number of times the entire inventory passes through during a period of time.

15. Inventory to Sales Ratio:

Measure of stock levels against sales. This helps managers identify monthly increases in inventory against falling sales.

These storage & inventory management KPIs are of immense value when it comes to maximizing storage utilization and reducing cost of inventory. For example, a low inventory turnover spurs you to track down a reason and helps you improve inventory management.

Pick & Pack

The process of picking & packing directly impacts lead time. Greater accuracy in picking means shorter lead time.

Picking in the right order decreases the rate of order return and increases customer satisfaction.

16. Picking and Packing Cost:

The cost incurred per order line, including handling, labeling, relabeling, and packing.

17. Picking Productivity:

The number of order lines picked per hour.

18. Picking Accuracy: 

The percentage of orders picked and packed without error.

19. Labor and Equipment Utilization:

The percentage of labor & pick/pack equipment out of the total labor and equipment utilized during the process.

20. Picking Cycle Time:

Time taken to pick each order.

Distribution

As the roles and responsibilities of warehouses expand with the growth of always-on supply chain, the added function of distribution exerts additional pressure on warehouse management. Here are some warehouse KPIs relevant to distribution:

21. Order Lead Time:

The average time taken by an order to reach the customer once the order has been placed. This is one of the most crucial KPIs for warehouses and distribution centers.

22. Perfect Order Rate:

Number of orders the warehouse delivered without error. It indicates the success rate of the warehouse/distribution center.

23. Back Order Rate:

The rate at which orders are coming in for items that are out of stock. There are situations wherein unexpected spike in demand causes this. However, if this rate is consistently high, it is an indication that there are lapses in planning and forecasting.

These distribution KPIs will help you diagnose underlying problems.

For example, a high back-order rate indicates that a warehouse or distribution center isn’t stocking the appropriate inventory volumes. In this case, the problem lies in understanding consumer behavior and better forecasting demand so as to properly set inventory levels.

Reverse Logistics

The returns and reverse logistics is another crucial process where warehouse KPIs need to be measured. In most cases, the always-on warehouse is exposed to this process, and it’s essential to measure its efficiency and effectiveness.

Here is a warehouse KPI that should not be ignored if you are exposed to this process:

24. Rate of Return: 

The rate at which goods, once sold, are being returned. This is most effectively used when segmented by reason for return.

This is one of the top warehouse KPIs that can help the warehouse/operations manager diagnose the exact reasons for rising warehousing costs and customer dissatisfaction, as it lets you dig into the reasons for returns.


FTT – First Time Through

Aside

First Time Through is the percentage of the time that a product or service passes through a process step without any defects on the first attempt.

  • It is a measure of production efficiency, ability/skill, and quality.
  • It measures how many goods are produced correctly without flaws or re-work as percentage of total units produced in a production process or value stream.

This concept can also be easily applied to the service industry as a measure of service or orders delivered satisfactorily to customers the first time without any amendments, re-work, or complaints.

Should a discrete manufacturer focus on overall production yield (Traditional Method), or on first time through yield?

In short, we recommend manufacturers focus on first time yield—let’s discuss why this is a more effective metric.

How do you calculate overall production yield (Traditional Method)?

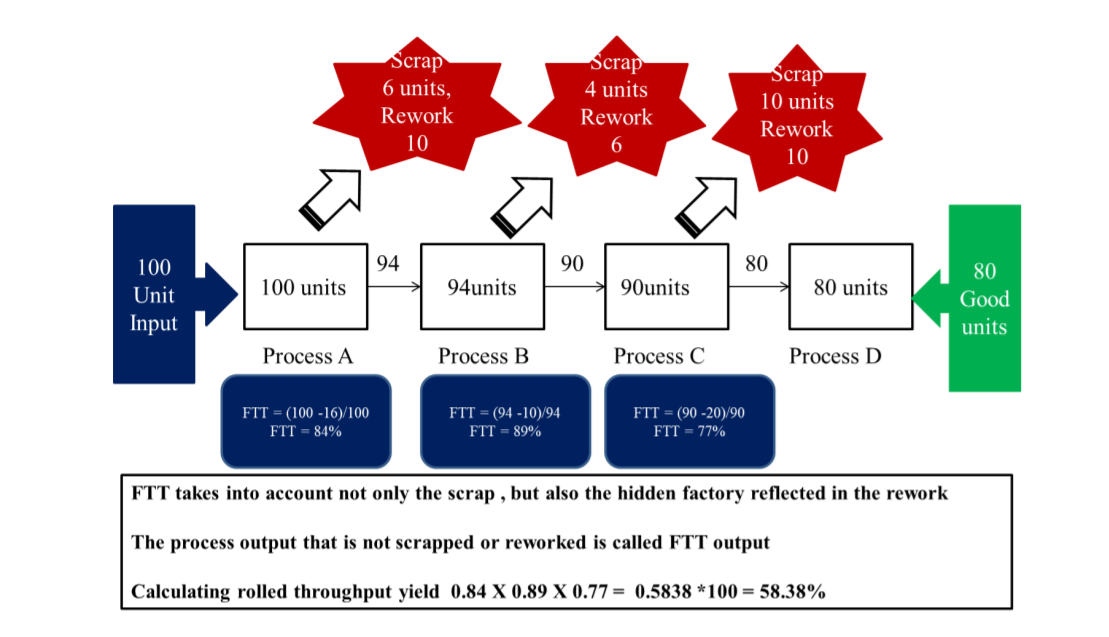
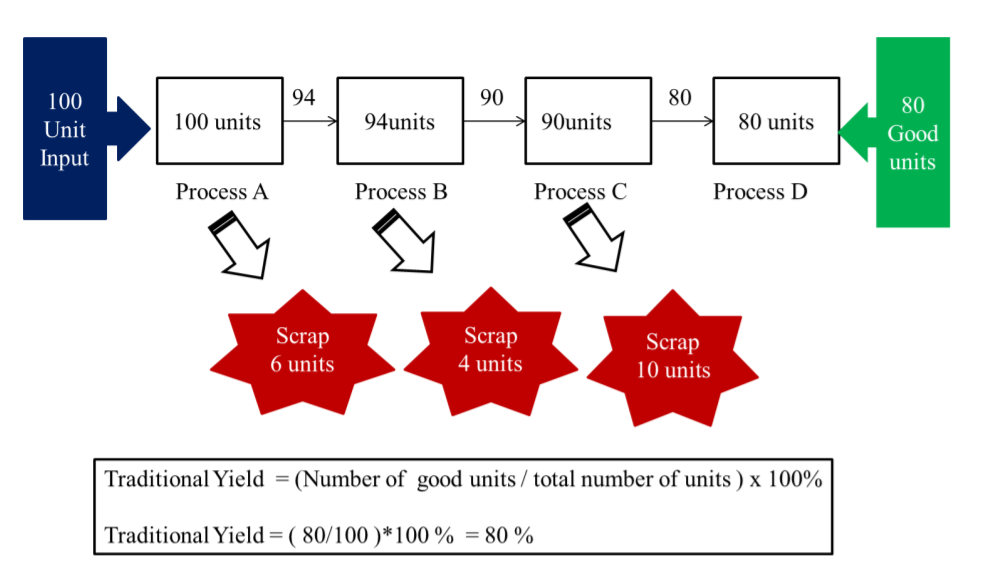
80% yield may sound great, we have calculated the yield only based on final scrap items, we haven’t considered the rework included. FTT will help us in calculating the hidden cost (rework) of manufacturing.

How do you calculate FTT?

The output is same in both the processes but the Yields are different. FTT helps us in calculating the actual yield of the process.

Benefits of Tracking FTT
  • Hidden Cost – Helps in calculating the cost of rework or repair
  • Great measure of efficiency – This data is easy to communicate and is often used as part of overall efficiency calculations, such as OEE (overall equipment efficiency).
  • Identifying areas of improvement – First time yield, along with throughput yield, are key metrics used to determine where the quality issues are occurring, and their impact to the system.


Article By Thomas B.