IMPACT OF INDUSTRY 4.0 ON SUPPLY CHAINS AND ITS BENEFITS

Aside

Industry 4.0 is fast transforming how businesses manage their key functions.  Digitalization aided by disruptive new technologies such as IoT, AI, big data & analytics,  machine learning, automation and robotics, cloud computing, blockchain, 3D printing, etc. and  the explosive growth of smart devices is leaving no segment of the business untouched.  

Supply chain management, more complex than ever before, stands to benefit tremendously  from going digital. Studies suggest that an interconnected, digital supply chain can lower  operational costs by more than 30 percent, reduce lost sales opportunities by more than 60  percent, and even reduce inventory requirements by more than 70 percent, all while making  companies faster, more agile, granular, accurate, and efficient.  

While transitioning to a digitized, automated and fully interconnected supply chain requires  significant efforts and long-term investments, the pay-offs are huge. Bringing supply chains  online can help enterprises reach the next level of operational effectiveness and realize  significant cost reductions. Here we discuss how digitalization makes the supply chain more  efficient: 

5 Key Benefits and the Impact of Industry 4.0 on Supply Chain

  1. 1. Greater Transparency and Accuracy 

Global supply chains can involve thousands of suppliers operating within the supply chain  ecosystem of a company. In such cases, ensuring end-to-end transparency and real-time asset  tracking is crucial, any gaps in supply chain risk management can lead to supply chain  disruptions, lost sales, and unnecessary costs. Going digital enables companies to track the  entire supply chain in real time, such as finding out the exact location of goods (on order, in  transit, or in a warehouse). Advanced solutions easily track inventory by combining updates  from supply chain partners with IoT data. This improves order accuracy and ETAs (minimizing  out-of-stock situations), enhances lot and batch control, optimizes inventory, and lowers  associated costs. 

  1. 2. Increased Interconnectedness and Collaboration 

A fully integrated, digital supply chain management software enables information to flow  seamlessly between suppliers, manufactures, and customers, taking collaboration to the next  level. Being a shared platform, it breaks silos and transforms planning into a continuous  process. It enables greater trust and support, and joint planning solutions, especially in cases of  non-competitive relationships. Stakeholders can choose to carry out supply chain-related  activities together to not only save costs, but to share best practices and learn from each other.  

An interconnected platform also lowers lead times through better communication, as suppliers  can provide warnings early, increasing a company’s responsiveness to risk. Another vital  feature of such closed-loop planning is that pricing decisions are integrated with demand and  supply planning; prices can be changed as per the expected demand, stock levels, and  replenishment capacity. This boosts revenues and optimizes inventory. 

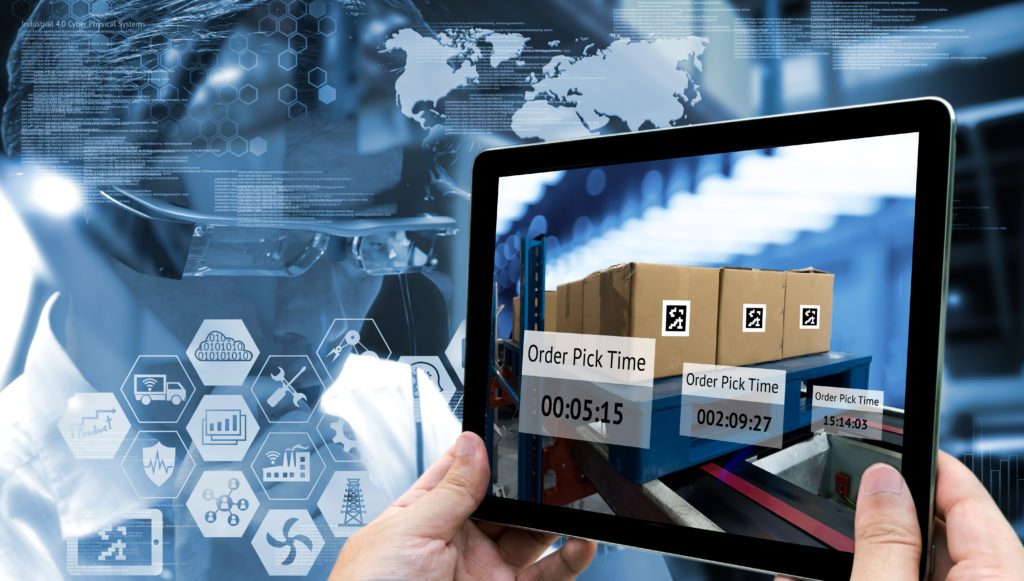
  1. 3. Improved Warehouse Management 

Digitalization can significantly improve warehouse management capabilities, especially with  regard to supply chain inventory and transportation logistics. For example, sensors can track  goods in real time, and accurately predict how long it will take for a consignment to arrive. Such  real-time tracking ensures on-time pickup and delivery. RFID technology can predict the exact  location of a product, even its exact position inside a truck. Such preciseness helps managers  provide location-based instructions to workers, saving time. Labour hours consumed per order  are also reduced. Thanks to tracking devices, companies can avoid last-minute shocks such as  inadequate quantity or non-compliance. Machine-to-machine communication also optimizes the  number of carriers per shipment, reducing transportation costs. Inventory storage per square  foot is also optimized through accurate demand prediction. This way, plant managers can easily  control the flow of inventory globally.

  1. 4. “Intelligent” Supply Chain 

“Thinking” supply chains can “learn” to recognize risks and change their supply chain  parameters to mitigate such risks. They continuously evolve and learn to handle many  exceptions without the need for any human involvement, except in case of any unforeseen risks,  when human intervention is required to determine the next course of action. 

  1. 5. Greater Agility 

Advanced supply chain solutions integrate data from suppliers, service providers, etc. in a  “supply chain cloud”, ensuring that all stakeholders take decisions based on the same facts.  Such end-to-end, real-time visibility will enable companies to respond more swiftly to disruptions  in real time and minimize risk. Also, the emergence of “Supply Chain as a Service” will increase  agility significantly.  

Clearly, companies have a lot to gain from improving their supply chain management in Industry  4.0, and those that are reluctant to do so run the risk of becoming uncompetitive.


Article by:- Akash Chowkampally

Capacity Planning for Manufacturing

In this blog we will be learning the basics of capacity planning and how to do it, With help of this you can perform capacity analysis for any manufacturing facility. So let’s get in to details of it.

What is capacity?

As name suggests capacity is the maximum amount that something can contain or produce, in manufacturing terms we can say that capacity is ability to manufacture a particular quantity of products in a particular duration of time.

So what about the planning

Capacity planning is basically an analysis done to check whether a manufacturing plant can produce a particular no of products in a given period, with available no of resources.

The capacity is calculated over days or weeks or months. The measurement is done in a way that we can adjust our production capacity according to the demand from the market.

Normally capacity planning is done on machines or equipment. There will be two outcome of this analysis; either there is capacity or numbers.

If want to take in to consider the number, then we can tell how much more machines to be required to fulfil the demand.

Calculation of Machine hour Capacity

Our first step is to understand and calculate the capacity of the machine hour in the factory. For an example if a factory has 200 machines, and the workers in the factory utilize the machine from 8 am to 6 pm for 10 hours a day, then the capacity would be 10 multiplied by 200, which comes to 2000 machine hours.

Production capacity with a single product

1st step to calculate capacity with single product is to determine time to produce a single product, and then it is divided by the plant capacity in hours.

For example, if one worker takes 40 minutes (0.66hrs) on a machine to make one product and the capacity of the machine has 2000 hours, then the production capacity would be

2000 / 0.66, then this would be 3003 units per day

How to do capacity planning

For better understanding let’s see an example

Suppose manufacturing plants needs to produce 100 units per day and we need to do capacity analysis

And if this product requires two operations A and B and its standard times are 5 minutes and 10 minutes respectively.

So the standard times are calculated by a method called time study.

And also operation A and B use two machines X and Y respectively. And presently have one each.

Standard working time of this plant is 420 minutes per shift breaks are excluded and this plant operates three shifts per day.

Also on an average 30 minutes is required for both machines for maintenance or we can say for down time, change overs, etc.

Suppose 98% is the yield of the both machines. Also these two machines is only able to run at 85% efficiency of its standard speed, if we take in to consideration of minor stoppages.

So let’s calculate.

Considering the minor speed loss, cycle time per product for both machines will be 5/(0.85) and 10/(0.85) minutes, respectively.

This is 5.88 and 11.76 respectively.

Also since yield for these machines is 98%, to produce 2% more of the demand, which is, 100 x 1.02 = 108

Now let’s calculate load on each machines.

  1. Calculate load of the machine X…

This is equal to demand per shift x cycle time

= (108/3) x 5.88

= 211.68 minutes.

  1. Calculate load of the machine Y…

This is equal to demand per shift x cycle time

= (108/3) x 11.76

= 423.36 minutes.

Now let’s calculate no of each machine required for meeting the demand.

No of the machine = Load per shift / Available time per shift per machine.

= 211.68 / (420 – 30)

= 0.54

This is one machine. And we have enough capacity for doing the operation A. No need to worry.

Now let’s check the capacity for operation B.

No of the machine = Load per shift / Available time per shift per machine.

= 432.36 / (420- 30)

= 1.11

So we require two machines for doing operation B.

We can conclude that there is a capacity issue. We only have one machine for doing operation B and we need one more.

This is how the capacity planning is been done


Article By – Shivank Kumar Choubey


Top 24 Warehouse KPIs

Aside

TOP 24 WAREHOUSE KPIS

Receiving

Among the most critical warehouse KPIs are the metrics that measure receiving performance. Warehouse operations begin with this process, and any inefficiencies here will snowball through all the subsequent processes.

Warehouse KPI metrics that correspond to the receiving process are:

1. Cost of Receiving Per Receiving Line:

The expense that the warehouse incurs on the receiving process of each receiving line. This includes handling costs as well.

2. Receiving Productivity:

Determined in terms of labour by measuring the volume of goods received per warehouse clerk per hour.

3. Receiving Accuracy:

Percentage of accurate receipts, i.e., the proportion of correctly received orders against purchase orders.

4. Dock Door Utilization:

Percentage of how many of the total dock doors were utilized.

5. Receiving Cycle Time:

The time taken to process each receipt.

These warehouse KPIs help managers identify any lapses in receiving and avoid a chain reaction of inefficiencies down the process line.

Catching inefficiencies, such as a long receiving cycle caused by busy dock doors, can reduce deficiencies as early as in the receiving stage.

Putaway

Once goods are received, the process of putaway begins with placing each item at a designated location selected for most convenient retrieval.

Effective putaway ensures a smooth picking process, thus significantly reducing lead time.

Here are some of the important warehouse KPIs that you must track to measure the efficiency of the putaway process:

6. Putaway Cost Per Line:

Expenses incurred for putting away stock per line, including labor, handling, and equipment costs.

7. Putaway Productivity:

Volume of stock put away per warehouse clerk per hour.

8. Putaway Accuracy:

Percentage of number of items put away accurately at the designated location.

9. Labor and Equipment Utilization:

Percentage of the labor and material handling equipment utilized during the put-away process.

10. Putaway Cycle Time:

Total time taken during the entire process of each put-away task.

Evaluating the putaway through these warehouse KPIs gives you a clear picture of potential inefficiencies in the process. Recognizing snags such as inaccuracies or scarcity of labor will help you to optimize and streamline the process.

Storage

Whether your warehouse is dependent on storing goods manually or uses AS/RS (Automated Storage and Retrieval System), you still need to measure efficiency. Here are some important warehouse KPIs to measure storage efficiency:

11. Carrying Cost of Inventory: 

The cost of storage over a particular span of time, including the cost of inventory, capital costs, service costs, damage costs, and costs of obsolescence. The longer the stock stays in storage, the higher the cost to the warehouse.

12. Storage Productivity:

Volume of inventory stored per square foot.

13. Space Utilization:

Percentage of space occupied by inventory out of the total space available for storage.

14. Inventory Turnover:

The number of times the entire inventory passes through during a period of time.

15. Inventory to Sales Ratio:

Measure of stock levels against sales. This helps managers identify monthly increases in inventory against falling sales.

These storage & inventory management KPIs are of immense value when it comes to maximizing storage utilization and reducing cost of inventory. For example, a low inventory turnover spurs you to track down a reason and helps you improve inventory management.

Pick & Pack

The process of picking & packing directly impacts lead time. Greater accuracy in picking means shorter lead time.

Picking in the right order decreases the rate of order return and increases customer satisfaction.

16. Picking and Packing Cost:

The cost incurred per order line, including handling, labeling, relabeling, and packing.

17. Picking Productivity:

The number of order lines picked per hour.

18. Picking Accuracy: 

The percentage of orders picked and packed without error.

19. Labor and Equipment Utilization:

The percentage of labor & pick/pack equipment out of the total labor and equipment utilized during the process.

20. Picking Cycle Time:

Time taken to pick each order.

Distribution

As the roles and responsibilities of warehouses expand with the growth of always-on supply chain, the added function of distribution exerts additional pressure on warehouse management. Here are some warehouse KPIs relevant to distribution:

21. Order Lead Time:

The average time taken by an order to reach the customer once the order has been placed. This is one of the most crucial KPIs for warehouses and distribution centers.

22. Perfect Order Rate:

Number of orders the warehouse delivered without error. It indicates the success rate of the warehouse/distribution center.

23. Back Order Rate:

The rate at which orders are coming in for items that are out of stock. There are situations wherein unexpected spike in demand causes this. However, if this rate is consistently high, it is an indication that there are lapses in planning and forecasting.

These distribution KPIs will help you diagnose underlying problems.

For example, a high back-order rate indicates that a warehouse or distribution center isn’t stocking the appropriate inventory volumes. In this case, the problem lies in understanding consumer behavior and better forecasting demand so as to properly set inventory levels.

Reverse Logistics

The returns and reverse logistics is another crucial process where warehouse KPIs need to be measured. In most cases, the always-on warehouse is exposed to this process, and it’s essential to measure its efficiency and effectiveness.

Here is a warehouse KPI that should not be ignored if you are exposed to this process:

24. Rate of Return: 

The rate at which goods, once sold, are being returned. This is most effectively used when segmented by reason for return.

This is one of the top warehouse KPIs that can help the warehouse/operations manager diagnose the exact reasons for rising warehousing costs and customer dissatisfaction, as it lets you dig into the reasons for returns.


VALUE STREAM MAPPING

Value Stream Mapping shows where you can improve your process by visualizing both its value-adding and non-value-adding steps.

What Is VSM?

Value stream mapping is a lean manufacturing or lean enterprise technique used to document, analyze and improve the flow of information or materials required to produce a product or service for a customer.

A value stream map displays all the important steps of the work process necessary to deliver value from start to finish. It allows visualizing every task that the team works on and provides single glance status reports about each assignment’s progress. It enables the team and leadership to see where the actual value is being added in the process, allowing them to improve on the overall efficiency associated with the delivery of a product.

VSM can be used for individual products and services for every type of business. 

Terminologies in VSM

·      Information Flow

This section shows the communication of process-related information and the transmission of data.

·      Product Flow

This section maps the steps of the development lifecycle from concept to delivery. It shows both the task being performed & the person or team performing task.

·      Cycle time (C/T)

It is the frequency of units produced or the average time between the completed production of one unit to the completed production of the next.

·      Setup Time (S/T)

It is the amount of time needed to prepare for a given step.

·      Uptime (%)

It gives an idea of the percentage of the total time that the processes or systems are actually active.

·      Time Ladder

The Time Ladder provides a visual representation of the value stream timeline.

The upper portion of the time ladder represents the average amount of time that a product spends in the queue or waiting at each stage.

The lower portion of the time ladder shows the average amount of time that each product was actively being worked on, or more specifically when value is actually being added to the product during that specific stage.

How to map the first Value Stream

Define your focus –

This is probably the most important step of the entire VSM exercise. Start with clearly defining the objective. With a clear objective in mind, identify the appropriate focus, scope, and process to be mapped.

Next, determine your fence posts, or the start and endpoints of your mapping exercise. A value stream map is not a process flowchart. It doesn’t need to map every possible inflow or outflow of the process. By maintaining focus on the predetermined objectives and fenceposts, the mapping activity is likely to stay on track and focused.

Go to Gemba (Walk the Process) –

“Go to Gemba” means go to the place where the work is being done. Visit the customer where the production is taking place and understand why they need the features they are requesting.

Define the basic Value Stream –

Start with preparing basic VSM as a starting point. The key thing here is to outline only the process basics and hereafter add the other details step by step.

Develop Current State Value Stream Map –

Starting with the basic VSM add the additional processes and their corresponding data, including current cycle times, lead times, up times, takt times, SLA’s, etc. This should reflect all stages within the defined fence posts, and their respective values as they currently are. This is known as your “Current State” VSM. This current state will be immensely important to keep the process baseline.

From this current state, the mapping team will be able to better understand the entire process. This enables the team to discuss productive what-if and to develop better solutions to identified hot points. It enables to provide a before and after comparison of the process and its performance figures to know if the changes have any desired impact.

Develop Target State Value Stream Map –

Once the current state VSM has been completed, the team will need to develop a Target State VSM. The target state represents a clear target of where you want to end up. These targets can be expressed in delivery velocity, quality-focused metrics, compliance, or any combination of these. The important thing here is to identify a goal to work.

Develop Future State Value Stream Map 

As improvements to the process are identified and planned, the VSM team will need to develop an implementation plan. These improvements will often require a phased approach to introduce necessary changes to achieve the target state.

To do this, a future state VSM should be created for each state of the implementation plan, which typically includes a 30, 60, 90-day view. This allows validating your assumptions at each stage of the implementation plan, to make sure the changes are having the desired impact and moving the value stream performance in the right direction. The future state VSM gives team members a unified view of the overall process as well as targeted objectives to work toward.