Single minute exchange of die

In this blog we will be learning about SMED and how to implement it.
The basic principle of Lean manufacturing is to increase the competitiveness of
companies by reducing costs. This philosophy seeks to get as close to the optimum as
possible, that is, to spend only what is indispensable of what adds value to the product.
In this sense the Lean manufacturing simply intends to remove all the possible waste.
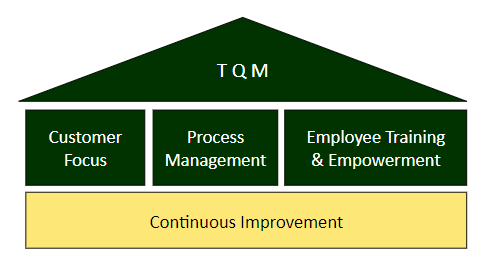
The principles of Lean are all focused on process improvement, which ultimately leads
to improved efficiency and this leads to higher profitability. One of the building blocks of
Lean relates to the rapid setup. The faster the setup times, the less equipment
downtime since waiting is part of the seven Muda (waste) of a production environment.

What is SMED

SMED is a set of techniques belonging to Lean manufacturing that aim to reduce the
setup time of a machine. When properly applied, it allows machines to take less time to
attach, giving more flexibility to the line.
SMED, also known as Quick Changeover of Tools, can be applied in any industrial unit
and to any machine. It is defined as the minimum amount of time necessary to change
the type of production activity. Thus, it takes into consideration the moment in which the
last piece of a previous lot was produced vis-à-vis the first piece produced by the
subsequent lot (Shingo, 1985).

Why the SMED is required?

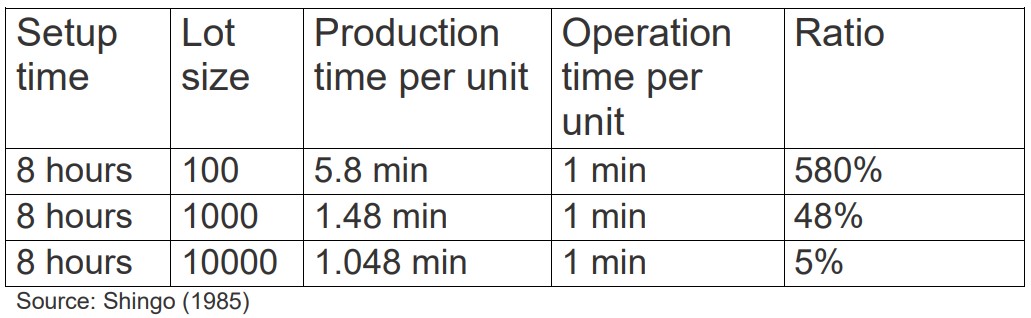
From the above example we can see that when our lot size increases, production to
operation time ratio decreases. But in this highly competitive market era every company
wants to increase the variety of products and wants to minimize the lot size as much as
possible.
So, for the small lot size it is necessary that the die changeover time should be not high
other wise it effects the production time and the cost of the product.

Steps in SMED

  • Observing and Recording.
  • Separation between internal and external tasks.
    • Internal tasks: activities performed during the change operation while the
      machine is in downtime.
    • External Tasks: activities performed before the change operation, not made in the downtime period.
  • Converting the maximum number of internal tasks into external tasks. Streamlining all the possible tasks.
  • Documenting internal and external procedures.
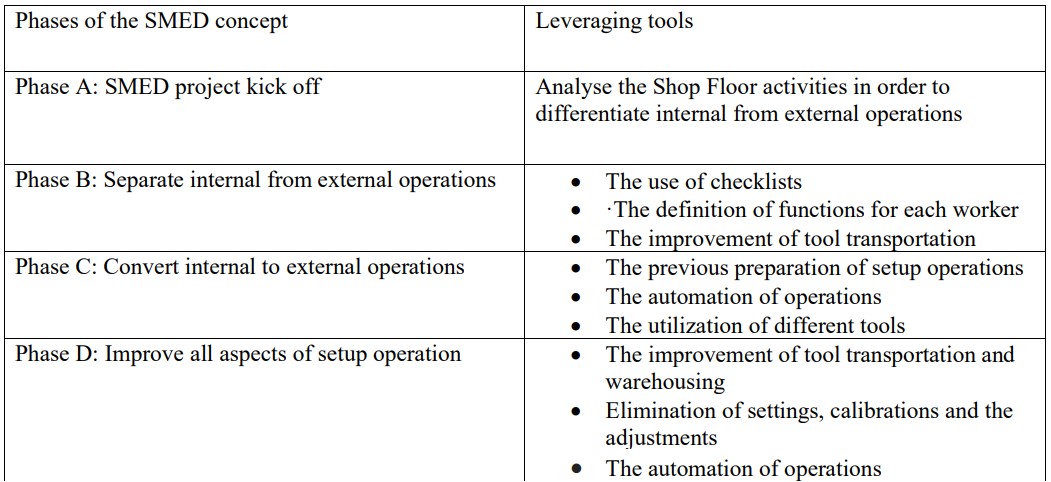
Phases in SMED

IMPACT OF INDUSTRY 4.0 ON SUPPLY CHAINS AND ITS BENEFITS

Aside

Industry 4.0 is fast transforming how businesses manage their key functions.  Digitalization aided by disruptive new technologies such as IoT, AI, big data & analytics,  machine learning, automation and robotics, cloud computing, blockchain, 3D printing, etc. and  the explosive growth of smart devices is leaving no segment of the business untouched.  

Supply chain management, more complex than ever before, stands to benefit tremendously  from going digital. Studies suggest that an interconnected, digital supply chain can lower  operational costs by more than 30 percent, reduce lost sales opportunities by more than 60  percent, and even reduce inventory requirements by more than 70 percent, all while making  companies faster, more agile, granular, accurate, and efficient.  

While transitioning to a digitized, automated and fully interconnected supply chain requires  significant efforts and long-term investments, the pay-offs are huge. Bringing supply chains  online can help enterprises reach the next level of operational effectiveness and realize  significant cost reductions. Here we discuss how digitalization makes the supply chain more  efficient: 

5 Key Benefits and the Impact of Industry 4.0 on Supply Chain

  1. 1. Greater Transparency and Accuracy 

Global supply chains can involve thousands of suppliers operating within the supply chain  ecosystem of a company. In such cases, ensuring end-to-end transparency and real-time asset  tracking is crucial, any gaps in supply chain risk management can lead to supply chain  disruptions, lost sales, and unnecessary costs. Going digital enables companies to track the  entire supply chain in real time, such as finding out the exact location of goods (on order, in  transit, or in a warehouse). Advanced solutions easily track inventory by combining updates  from supply chain partners with IoT data. This improves order accuracy and ETAs (minimizing  out-of-stock situations), enhances lot and batch control, optimizes inventory, and lowers  associated costs. 

  1. 2. Increased Interconnectedness and Collaboration 

A fully integrated, digital supply chain management software enables information to flow  seamlessly between suppliers, manufactures, and customers, taking collaboration to the next  level. Being a shared platform, it breaks silos and transforms planning into a continuous  process. It enables greater trust and support, and joint planning solutions, especially in cases of  non-competitive relationships. Stakeholders can choose to carry out supply chain-related  activities together to not only save costs, but to share best practices and learn from each other.  

An interconnected platform also lowers lead times through better communication, as suppliers  can provide warnings early, increasing a company’s responsiveness to risk. Another vital  feature of such closed-loop planning is that pricing decisions are integrated with demand and  supply planning; prices can be changed as per the expected demand, stock levels, and  replenishment capacity. This boosts revenues and optimizes inventory. 

  1. 3. Improved Warehouse Management 

Digitalization can significantly improve warehouse management capabilities, especially with  regard to supply chain inventory and transportation logistics. For example, sensors can track  goods in real time, and accurately predict how long it will take for a consignment to arrive. Such  real-time tracking ensures on-time pickup and delivery. RFID technology can predict the exact  location of a product, even its exact position inside a truck. Such preciseness helps managers  provide location-based instructions to workers, saving time. Labour hours consumed per order  are also reduced. Thanks to tracking devices, companies can avoid last-minute shocks such as  inadequate quantity or non-compliance. Machine-to-machine communication also optimizes the  number of carriers per shipment, reducing transportation costs. Inventory storage per square  foot is also optimized through accurate demand prediction. This way, plant managers can easily  control the flow of inventory globally.

  1. 4. “Intelligent” Supply Chain 

“Thinking” supply chains can “learn” to recognize risks and change their supply chain  parameters to mitigate such risks. They continuously evolve and learn to handle many  exceptions without the need for any human involvement, except in case of any unforeseen risks,  when human intervention is required to determine the next course of action. 

  1. 5. Greater Agility 

Advanced supply chain solutions integrate data from suppliers, service providers, etc. in a  “supply chain cloud”, ensuring that all stakeholders take decisions based on the same facts.  Such end-to-end, real-time visibility will enable companies to respond more swiftly to disruptions  in real time and minimize risk. Also, the emergence of “Supply Chain as a Service” will increase  agility significantly.  

Clearly, companies have a lot to gain from improving their supply chain management in Industry  4.0, and those that are reluctant to do so run the risk of becoming uncompetitive.


Article by:- Akash Chowkampally

Capacity Planning for Manufacturing

In this blog we will be learning the basics of capacity planning and how to do it, With help of this you can perform capacity analysis for any manufacturing facility. So let’s get in to details of it.

What is capacity?

As name suggests capacity is the maximum amount that something can contain or produce, in manufacturing terms we can say that capacity is ability to manufacture a particular quantity of products in a particular duration of time.

So what about the planning

Capacity planning is basically an analysis done to check whether a manufacturing plant can produce a particular no of products in a given period, with available no of resources.

The capacity is calculated over days or weeks or months. The measurement is done in a way that we can adjust our production capacity according to the demand from the market.

Normally capacity planning is done on machines or equipment. There will be two outcome of this analysis; either there is capacity or numbers.

If want to take in to consider the number, then we can tell how much more machines to be required to fulfil the demand.

Calculation of Machine hour Capacity

Our first step is to understand and calculate the capacity of the machine hour in the factory. For an example if a factory has 200 machines, and the workers in the factory utilize the machine from 8 am to 6 pm for 10 hours a day, then the capacity would be 10 multiplied by 200, which comes to 2000 machine hours.

Production capacity with a single product

1st step to calculate capacity with single product is to determine time to produce a single product, and then it is divided by the plant capacity in hours.

For example, if one worker takes 40 minutes (0.66hrs) on a machine to make one product and the capacity of the machine has 2000 hours, then the production capacity would be

2000 / 0.66, then this would be 3003 units per day

How to do capacity planning

For better understanding let’s see an example

Suppose manufacturing plants needs to produce 100 units per day and we need to do capacity analysis

And if this product requires two operations A and B and its standard times are 5 minutes and 10 minutes respectively.

So the standard times are calculated by a method called time study.

And also operation A and B use two machines X and Y respectively. And presently have one each.

Standard working time of this plant is 420 minutes per shift breaks are excluded and this plant operates three shifts per day.

Also on an average 30 minutes is required for both machines for maintenance or we can say for down time, change overs, etc.

Suppose 98% is the yield of the both machines. Also these two machines is only able to run at 85% efficiency of its standard speed, if we take in to consideration of minor stoppages.

So let’s calculate.

Considering the minor speed loss, cycle time per product for both machines will be 5/(0.85) and 10/(0.85) minutes, respectively.

This is 5.88 and 11.76 respectively.

Also since yield for these machines is 98%, to produce 2% more of the demand, which is, 100 x 1.02 = 108

Now let’s calculate load on each machines.

  1. Calculate load of the machine X…

This is equal to demand per shift x cycle time

= (108/3) x 5.88

= 211.68 minutes.

  1. Calculate load of the machine Y…

This is equal to demand per shift x cycle time

= (108/3) x 11.76

= 423.36 minutes.

Now let’s calculate no of each machine required for meeting the demand.

No of the machine = Load per shift / Available time per shift per machine.

= 211.68 / (420 – 30)

= 0.54

This is one machine. And we have enough capacity for doing the operation A. No need to worry.

Now let’s check the capacity for operation B.

No of the machine = Load per shift / Available time per shift per machine.

= 432.36 / (420- 30)

= 1.11

So we require two machines for doing operation B.

We can conclude that there is a capacity issue. We only have one machine for doing operation B and we need one more.

This is how the capacity planning is been done


Article By – Shivank Kumar Choubey


Total Quality Management (TQM)

Aside

Let us first understand what is TQM and after that we will look into its 4 major pillars which helps us in TQM for achieving desired results.

Total = Made up of the whole.
Quality = Degree of excellence of a product or service provides.
Management = Art of Planning, Organizing, Controlling etc.

TQM can be further divided into 3 parts as follows

System = All persons of all divisions at every stratum.
Method = In methods there are different tools and methods which are used to
achieve desired result such as Kaizen, QC Circle, 5S, TPM, MSA, OEE etc.
Purpose = Purpose can be any of the following from (QCDSME).
▪ Q: Quality improvement
▪ C: Cost reduction
▪ D: Delivery execution
▪ S: Safety maintenance
▪ M: Morale boosting
▪ E: Environmental protection

TQM can be defined as a management approach for an organization, centred on quality, based on the participation of all its members and aiming at long-term success through customer satisfaction, and benefits to all members of the organization and to society. And the main motive of TQM is to “Do the right things right the first time, every time”

❖ 4 Pillars of TQM

  1. Customer Focus: Studying customer needs, gathering customer requirements, and measuring and managing customer satisfaction. Customer satisfaction is seen as the company’s highest priority. The company believes that it will only be successful if its customers are satisfied.
  2. Process Management: Develop a production process that reduce the product variations. Applying the same process; the same product should be produces with the same level of quality every time. Teams are process-oriented, and interact with their internal customers to deliver the required results. Management’s focus is on controlling the overall process, and rewarding teamwork.
  3. Employee Empowerment: TQM environment requires a committed and well trained work force that participates fully in quality improvement activities. Ongoing education and training of all employees supports the drive for quality.
  4. Continuous Improvement: TQM recognizes that product quality is the result of process quality. As a result, there is a focus on continuous improvement of the company’s processes. This will lead to an improvement in process quality. In turn this will lead to an improvement in product quality. Measurement and analysis id the tool that has been used for that


Article By.

Dhavalkumar Gohel

FTT – First Time Through

Aside

First Time Through is the percentage of the time that a product or service passes through a process step without any defects on the first attempt.

  • It is a measure of production efficiency, ability/skill, and quality.
  • It measures how many goods are produced correctly without flaws or re-work as percentage of total units produced in a production process or value stream.

This concept can also be easily applied to the service industry as a measure of service or orders delivered satisfactorily to customers the first time without any amendments, re-work, or complaints.

Should a discrete manufacturer focus on overall production yield (Traditional Method), or on first time through yield?

In short, we recommend manufacturers focus on first time yield—let’s discuss why this is a more effective metric.

How do you calculate overall production yield (Traditional Method)?

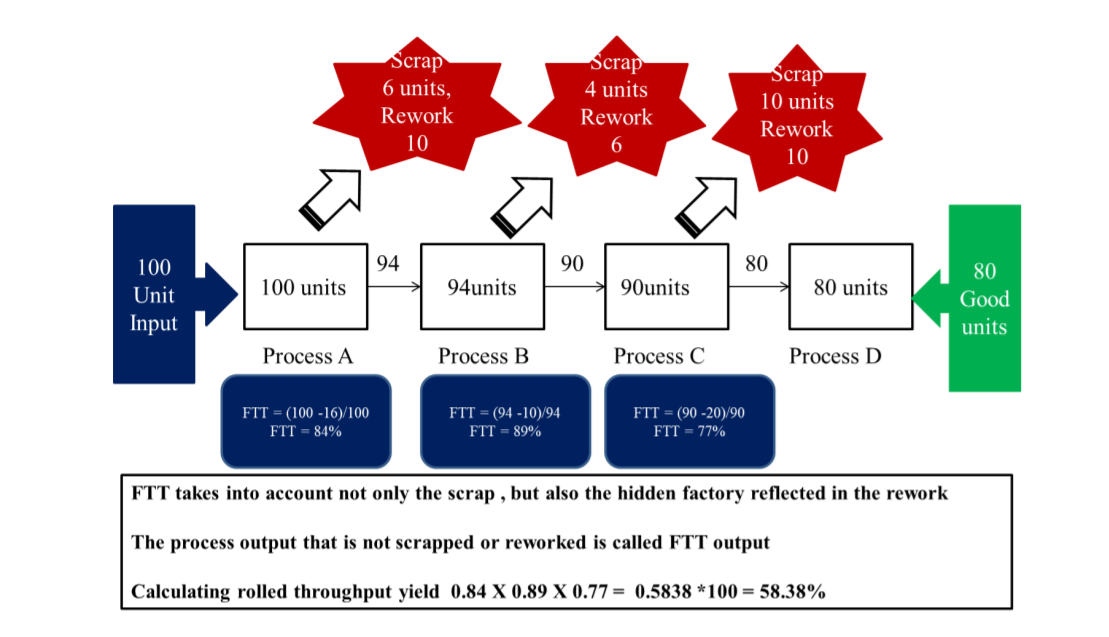
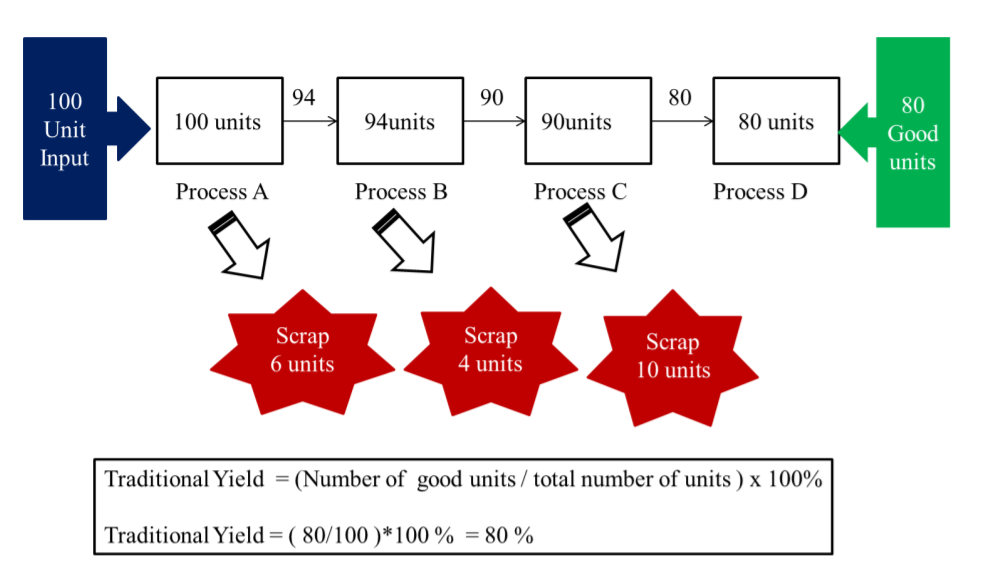
80% yield may sound great, we have calculated the yield only based on final scrap items, we haven’t considered the rework included. FTT will help us in calculating the hidden cost (rework) of manufacturing.

How do you calculate FTT?

The output is same in both the processes but the Yields are different. FTT helps us in calculating the actual yield of the process.

Benefits of Tracking FTT
  • Hidden Cost – Helps in calculating the cost of rework or repair
  • Great measure of efficiency – This data is easy to communicate and is often used as part of overall efficiency calculations, such as OEE (overall equipment efficiency).
  • Identifying areas of improvement – First time yield, along with throughput yield, are key metrics used to determine where the quality issues are occurring, and their impact to the system.


Article By Thomas B.