Lean Facility Layout Planning: The Catalyst for Transformation

As a Lean Practitioner, whenever I visit a factory for the first time my initial observation is always excess material movement on the shop floor.  That is why before starting any improvement journey, mapping the process flow and the spaghetti diagram is the first step that is taken. The objective is to identify the scope of improving throughput by establishing a well-planned facility layout.

An unplanned factory layout planning results in major wastes like transportation, waiting, and Inventory.  A proper factory layout impacts the throughput time and boosts productivity, and worker morale & reduces unevenness in work & stress. So basically, it acts as a direct action against the three wasteful practices, Muda, Mura & Muri.

What is a Lean Facility Layout?

Lean Facility Layout is a systematic approach used in designing the production facility or warehouse which is based on the principles of Lean Manufacturing. The focus is on creating a flow that has no unnecessary steps, or activities, one that adds “Value” to the Product that is manufactured. A lean facility layout emphasizes easy-to-adapt and flexible workplace operations.

What do you need?

Always get a clear understanding of your processes. Whether you are planning a new facility, or refining the existing one, it is very important to identify the pain areas in all processes of your facility. These could be directly or indirectly related to Manpower, Machine, Method, or Material. Interact with the shop floor workers and get their opinion on the current Operations.  You need to be very clear on the strategic requirements of your organization.

The Approach

A planned facility layout should take care of the following things: –

  1. 1. Space Utilization: Material stored horizontally on the floor is a common picture in the shop floor, & in most cases, there is clear vertical space available that can be utilized by implementing vertical material storage solutions.
  2. 2. Material Movement: Long material movement results in longer lead times, lower throughput time, and Productivity loss and creates uneven and stressful plant operations. A well-planned facility will ensure higher throughput, least lead time & optimize Productivity. This will reduce manpower costs and overall operational expenses.
  3. 3. Space for all: Area allocation for Maintenance, RND, QA, Rejections (Incoming and internal), Daily Plant Meetings (PPC and Quality), Segregation in the storage of Material (Incoming, FG, Buffer), etc will give a clearer shop floor picture to Managers, Customers, & Auditors of all activities well managed & sorted. Also, machines should be placed with enough clearances around for maintenance checks, repairs, part replacements, lubrication & cleaning.
  4. 4. Inventory: Machine-wise storage area for WIP (segregated as IP & OP), Supermarkets (to control inventories), Centralised trolley storage, Packing Material Storage, FG Area, and Hold Area. All these help in maintaining & controlling inventories across the facility. Non-moving material, rejections are brought to the notice of the management & decisions are made faster on the disposal of these materials, and lesser inventory means more profits.
  5. 5. Visual Management: The most efficient tool for communicating across the shop floor is Visual Management. Your Layout should have machines, areas, storage, walkways, and gangways Visually Identified. Not just this, it also helps in communicating standard procedures, highlighting problems, and bringing consistency & transparency to work.
  6. 6. Improved Worker Morale: With smooth material flow, sequenced machine areas, and well-managed inventories there remains a very low chance of ergonomic stress on workers, which boosts their productivity and helps in nurturing the Process Excellence culture in the shop floor.
  7. 7. A plant layout should also ensure safety standards are followed. Power units, cables, hazardous chemical storage, etc. should be isolated from the Operational areas. Effective use of safety shoes, PPEs, etc. should be promoted by using Visual Management tools. Such factors while planning a facility will help in sustaining a Safe factory culture.
  8. 8. Flexibility: Keeping in mind the Plant operations, one should analyze whether there are multiple SKUs. Do all the SKUs have standard processes or there are multiple process routes? If the demand is not steady, the layout should be planned considering the excess capacity requirements.
  9. 9. A detailed diagnostic study of the existing state should determine the requirements before Planning the facility, and the final layout should be flexible to changes, the mentioned constraints should be taken care of.
  10. 10. Visibility: Plant layout should be planned in a way that the machines and ongoing activities are part of the value chain and should always be observable.  The arrangement of departments, offices/cabins should be made in such a way that the shop floor is easy to supervise.

Types of Facility Layout?

While you plan a facility layout, it is necessary to understand what ideally fits you the best. To begin with, one has to understand 4 major types of layouts and relate those with the Operations of the Plant in mind.

  1. 1. Product Layout: Plant, where there are large volumes & standardized products involved, with very few SKUs, a Product Layout, is the ideal choice. Product layout or the Assembly Line has workstations arranged in a sequential way where the RM enters the line, and at the end of the line, you get the finished Product. A product layout is usually in a U shape or a straight line.

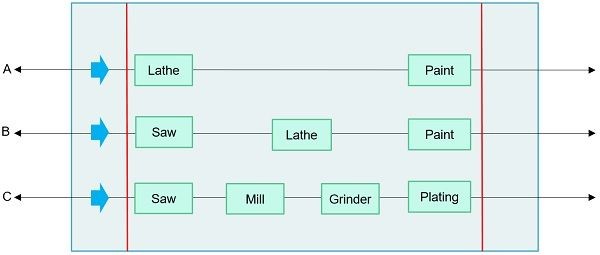
Figure 1 Ref: https://keydifferences.com/

  1. 2. Process Layout: A process layout is one where machinery, equipment, or workstations with the same process/functions are grouped together. Basically, equipment with similar functions is combined at one location. Ex. All the welding activities for a Panel manufacturer are grouped in one common area.

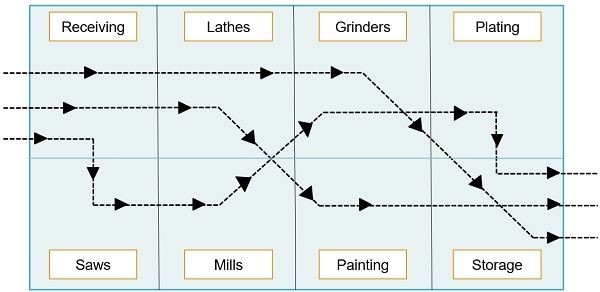
Figure 2 Ref: https://keydifferences.com/

  1. With this approach, you can establish a Plant with a functional arrangement of the layout, where the Product will move to different areas as per its process route & then finally get finished at the common assembly or FG area/process. A plant with non-standardized products should opt for such a layout.

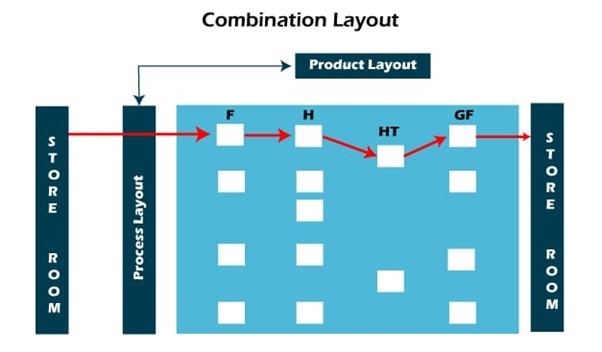
Figure 3 Ref: https://www.javatpoint.com/types-of-layouts

  1. 3. Combination Layout: When there are multiple types of products & the quantities are on the higher side, Process layouts arranged in a line in a sequential manner are implemented. Simply the machines performing similar functions are grouped, and these groups are arranged in sequences to manufacture products of different specifications in large quantities.

Well, the question arises here. How to do it?

The systematic way to begin with would be as follows: –

  1. 1. Define the objectives: Understand the strategic requirements of the organization & define the key milestones to achieve.
  2. 2. Current State Mapping: Map the existing procedures, manpower, equipment, capacity & storage requirements.
  3. 3. Material Flow Analysis: If it is a re-layout activity, prepare a spaghetti diagram of the material movements, and measure the distance traveled for runner items. Analyze the flow of the material & target measure Non-Value adding, zigzag, reverse movements of material that are wasteful & avoidable.
  4. 4. Space Allocation: Understand the architectural drawing of the plant, and understand the limitations with respect to pillars, walls, or other obstacles. Brainstorm with key stakeholders and note down their requirements, priorities, and constraints. Allocate tentative areas for machines, processes, storage, etc. Make sure future expansion plans are considered while doing this.
  5. 5. Dimensioning: Note machine dimensions & clearances required, storage equipment dimensions, and gangway width required.
  6. 6. Design: Start plotting machines as per factors studied one by one. Focus on a particular stage of the manufacturing process. It might involve 2-3 machines and a storage area. The next step is to check clearances around the machine, & prediction of possible constraints. With this approach start following the process route & go on the plotting machine. One has to understand that once a tentative layout is done, multiple constraints, & ideas will be visible.
  7. 7. Brainstorming in Design: The first tentative plan will highlight multiple constraints, also it will give out many ideas. Constraints might be related to material movement, storage, operating space, material handling equipment, etc. Categorizing the constraints in multiple ways will help in finding solutions, and in this way, multiple layout options can be developed.
  8. 8. Future State: Create a “to be” spaghetti diagram for key products & check the material travel distances reduced for each layout, comparing with the current state. Highlight the top 3 cases with a major reduction in movement. These are the layouts you have to focus on.
  9. 9. Feasibility check: Once you have 4-5 options on paper, then it’s time to review these with the stakeholders. At this stage, you have to check the most feasible layout as per current & future demand. Stakeholders can give deeper insights into possible challenges.

Conclusion

Space utilization, higher throughput, reduced inventories, reduced material handling costs, improved safety & high worker morale are your key milestones. As we are into the World Class Manufacturing Era, these are the milestones that will take you toward the goal that is Lean Facility Layout, and by the way the goal is just the first step towards Process Excellence or Lean Manufacturing. Because it is not the destination, it is the pursuit of “Continuous Improvement”.

Understanding Corrective and Preventive Action (CAPA): A Key Element of Quality Management

Introduction:

In the realm of quality management, organizations are constantly striving for excellence, seeking ways to improve processes, reduce errors, and enhance customer satisfaction. One vital tool in this pursuit is the Corrective and Preventive Action (CAPA) process. CAPA is an integral component of quality management systems, enabling businesses to identify, investigate, and rectify issues while implementing preventive measures to prevent their recurrence. This article delves into the concept of CAPA, its importance, and how it contributes to organizational growth and continuous improvement.

What is CAPA?

Corrective and Preventive Action (CAPA) is a systematic approach employed by organizations to identify, address, and prevent non-conformities, deviations, or deficiencies in products, processes, or quality systems. The primary objective of CAPA is to detect and correct problems, as well as to implement measures to prevent their recurrence, ultimately enhancing the overall quality and reliability of products or services.

The CAPA Process:

The CAPA process typically involves the following key steps:

Issue Identification: The first step in the CAPA process is to identify the issue or non-conformity through various means, such as customer complaints, internal audits, quality data analysis, or regulatory requirements. This ensures that problems are captured and addressed promptly.

Problem Investigation:

Once an issue is identified, a thorough investigation is conducted to determine its root cause. This involves gathering relevant data, analyzing the problem, and using various problem-solving techniques such as the 5 Whys, fishbone diagrams, or fault tree analysis. The goal is to uncover the underlying causes and understand the contributing factors.

Corrective Action:

Based on the investigation, corrective actions are developed and implemented to address the identified root cause and eliminate the problem. Corrective actions can involve process modifications, retraining employees, updating procedures, or implementing technical fixes. The effectiveness of these actions should be monitored to ensure their success.

Preventive Action:

In addition to addressing the immediate problem, CAPA also focuses on preventive measures to avoid similar issues in the future. This step involves identifying potential risks, implementing preventive actions, and monitoring their effectiveness. Preventive actions can include process improvements, regular training programs, enhanced quality controls, or updated documentation.

Verification and Monitoring:

The final step in the CAPA process is to verify the effectiveness of the corrective and preventive actions taken. This involves evaluating whether the implemented measures have resolved the problem and assessing their long-term impact. Ongoing monitoring and measurement are necessary to ensure sustained compliance and continuous improvement.

Benefits of CAPA:

Implementing an effective CAPA process offers several benefits to organizations, including:

Enhanced Quality:

CAPA helps organizations identify and eliminate the root causes of quality issues, resulting in improved product or service quality and customer satisfaction.

Compliance with Regulations:

By addressing non-conformities and implementing preventive measures, CAPA enables organizations to comply with industry standards, regulations, and customer requirements.

Continuous Improvement:

CAPA fosters a culture of continuous improvement by promoting problem-solving, data-driven decision-making, and proactive risk management.

Cost Reduction:

Through the identification and elimination of issues, CAPA helps organizations minimize rework, waste, and customer complaints, leading to cost savings.

Organizational Learning:

CAPA encourages knowledge sharing and organizational learning, as the process involves analyzing data, identifying trends, and disseminating lessons learned throughout the organization.

Conclusion:

Corrective and Preventive Action (CAPA) is a fundamental process within quality management systems, enabling organizations to proactively identify and address issues while preventing their recurrence. By embracing CAPA, organizations can achieve higher levels of quality, regulatory compliance, and customer satisfaction.

Kanban Cards

What is Kanban?

The Kanban system is an information system that harmoniously controls the production of the necessary products in the necessary quantities at the necessary time in every process of a factory and also among companies.

Bullwhip effect

The Bullwhip effect in supply chain management refers to a situation where even small changes in customer demand can lead to significant fluctuations in production quantities for manufacturers.

To minimize these variations and ensure smoother production, a method called production smoothing is implemented. This process is facilitated by using Kanban cards.

Kanban cards – application

1. IT support: A support ticket can move through different stages like triage, assignment, resolution and closure. This helps keep track on number of support tickets.

2. Healthcare service: Each patient can be assigned a Kanban card and its movement can be tracked. For e.g. entry stage forms are filled, payment is done, progress in the health etc.

3. Manufacturing: To help reduce WIP (work in progress), inventory and prevent over or under production

4. Event management

Classification of Kanban cards

Production ordering Kanban

Ø These signals prompt the preceding activity to begin manufacturing when the inventory in the “semi-finished goods store” reaches a reorder level.

Ø For e.g. For an engine assembly line, Kanban’s will be attached on scheduling board which has “color-coded scale”.

Ø Inventory racks which hold semi finished goods like crank shaft, piston and cylinder are being consumed, assemblies are completed and thus inventory reduces reaching the reorder point.

Ø Kanban’s are attached on these scheduling boards signifying inventory of semi finished goods store. When Kanban’s reach the top of the red area, the respective machining shops (preceding activity) are notified to start manufacturing of the respective items.

Withdrawal kanban

Ø These signals prompt the material handler to withdraw items from the centralized store for different workstations.

Ø For e.g. There is an assembly line which produces smartphones. It has four different types of assembly lines: electronic board, screen, batteries and casing

Ø Each workstation will have its individual store where respective parts will be stocked.

Ø As the assembly progresses, parts are consumed, leading the individual stores near workstations to reach the “reorder point” levels.

Ø The Mizusumashi (kanban and material handler) will take the Kanban card of the required item as an “authorization” to withdraw the item from the central store.

Ø The central store too will have re-order points set for its inventory. Once the inventory levels reach the reorder point, the Mizusumashi (Kanban and material handler) will notify the store keeper to re order the items from the supplier.

Supplier kanban

Ø Supplier Kanban will help notify the supplier to refill the inventory levels.

Ø It is very crucial to minimize the fluctuation in ordering of inventory from the supplier. Thus two types of information are conveyed to the suppliers.

Ø There are certain calculations done by the supplier after taking into consideration monthly production schedule as follows

Supplier Kanban – Monthly Information

Supplier Kanban – Daily production schedule

Ø Depending on the withdrawal system either “later replenishment” or “sequenced withdrawal system” is used to convey the daily production schedule.

Ø Later replenishment uses supplier Kanban (now E-Kanban for supplier) to refill the inventory levels of Toyota and sequenced withdrawal system uses scheduling table conveyed by E-Kanban.

Supplier Kanban – System of later replenishment

The idea of later replenishment system is to have simultaneous activities of:

1. Loading of goods from supplier which were made on the prompt of supplier Kanban delivered one day prior. Also to submit today’s request of inventory with supplier Kanban.

2. Unloading of goods of the truck which carries the requested inventory of the prior day from the supplier on Toyota’s site.

Benefits of kanban

Ø Kanban cards help manage work in progress

Ø Reducing excess inventory of raw material

Ø Eliminating over production to a great extent

Ø Kanban board also help spot the bottle neck process/stage

Ø Kanban boards also help prioritizing the work

Ø Helps provide transparency to all the stake holders regarding current stage in any given process through Kanban board

References

1. Michel B.(Reprint 2017). Lean logistics. Productivity Press.

2. Yasuhiro M. (4th Edition). Toyota Production System. CRC Press.

3. Website: theplanningmaster.com

4. Website: talentvis.com

Root Cause Analysis

What is Root Cause Analysis?

The Root Cause Analysis (RCA) is a technique that allows people to determine the reasons why a particular problem has occurred.

This technique identifies the source of the problem using precise steps and tools so that necessary steps can be taken in the future to avoid the problem from happening again. The root cause analysis is done in a systematic way. It involves different steps such as describing the existing problem, collecting the necessary data linked with the problem, identifying possible causes, identifying causes that need to be addressed to prevent the problem from recurring, identifying solutions, implementing changes, and observing the changes.

This particular tool can analyze a particular system at once. This is often used in complicated systems when multiple problems exist, and it is important to immediately get to the root cause of the problem. The current reality tree is created by listing all the undesirable events and problems observed in a particular process.

RCA is an important problem-solving tool used in quality improvement. It is one of the most useful tool in lean Six Sigma process improvement projects.

Basically, in the DMAIC approach the 3rd phase analyse is all about analyzing the data and finding cause of problem so in that phase RCA is used to identify the root cause of problems.

RCA is not a single person approach, it is completely a team-based approach where a team of 3-4 members come together and focus on finding the root cause of the problem where they use a lot of different tea, decision-making techniques.

So that this team-based activity produces good results with consensus of all team member. Now let’s see the three basic types of causes because of which all the problem happen

There are three basic types of cause:

  1. 1. Physical causes– Tangible, material items failed in some way (for example, a car’s brakes stopped working).
  2. 2. Human causes– People did something wrong or did not do something that was needed. Human causes typically lead to physical causes (for example, no one filled the brake fluid, which led to the brakes failing).
  3. 3. Organizational causes– A system, process, or policy that people use to make decisions or do their work is faulty (for example, no one person was responsible for vehicle maintenance, and everyone assumed someone else had filled the brake fluid).

How to perform Root Cause Analysis

The 1st step of RCA is to identify the problematic situation and then analyze that situation to understand what’s happening there, and what are the different factors that are impacting the problematic area.

  1. 2. Gather data.

A critical step in root cause analysis is the collection of relevant data about an incident or a problematic event. Documenting all the characteristics and specifications of the event will help you answer questions like What are the contributing factors? When did the problem occur? Is it a repeating event? What is the observed impact?

  1. 3. Determine possible causal factors.

Creating a sequence of events is important to identify causal factors that can contribute to the observed problem or event. The project team tasked with the analysis of the problem should establish a timeline of events and brainstorm as many potential causal factors as possible by asking “Why?” questions. Using a causal graph, for instance, helps to visually represent the connection between events and enables tracking of the root cause.

  1. 4. Determine the Root Cause of the Problem

This is the time to identify as many causes as possible. The analysis team can use techniques such as the 5 WhysFishbone analysis, or Pareto chart to narrow down the potential underlying cause or causes of the problem and the major contributing factors. During this phase, stakeholders and other relevant teams should be involved.

  1. 5. Prioritize the Causes

Once the root causes are established, they need to be prioritized and tackled accordingly. To determine which cause or challenge to address first, the analysis team needs to assess what is the impact of the cause – the higher the impact, the greater its priority. Another point when prioritizing root causes is the number of causal factors triggered by a specific challenge – the greater the number of causal factors, the greater the impact of the root cause is and yields immediate addressing.

  1. 6. Solution, Recommendation, and Implementation

Next step upon establishing root causes and their prioritization is finding solutions to the problem and their implementation. Brainstorming is a great way to attempt and come up with a variety of potential solution scenarios. Another approach is interviewing as many people as possible. Gathering input as well as the implementation of the solution requires involvement from everyone. On one hand, every recommendation counts, and on the other, a successful implementation is the one that sticks with everyone affected.

6 Popular root cause analysis tools

The ultimate goal of root cause analysis is to find out the root cause of the problem and organize all the cause as per their impact on the problem and then action to prevent those problems from happening again.

In this entire process of finding the root cause of the problem, RCA uses 6 powerful tools.

1. 5 Whys Analysis

The 5 Whys is a method that uses a series of questions to drill down into successive layers of a problem. The basic idea is that each time you ask why, the answer becomes the basis of the next why. It’s a simple tool useful for problems where you don’t need advanced statistics, so you don’t necessarily want to use it for complex problems.

One application of this technique is to more deeply analyze the results of a Pareto analysis. Here’s an example of how to use the 5 Whys:

Problem: Final assembly time exceeds target

  • -> Why is downtime in final assembly higher than our goal? According to the Pareto chart, the biggest factor is operators needing to constantly adjust Machine A
  • -> Why do operators need to constantly adjust Machine A? Because it keeps having alignment problems
  • -> Why does Machine A keep having alignment problems? Because the seals are worn
  • -> Why are Machine A’s seals worn? Because they aren’t being replaced as part of our preventive maintenance program
  • -> Why aren’t they being replaced as part of our preventive maintenance program?

2. Failure Mode and Effects Analysis (FMEA)

The failure mode and effects analysis (FMEA) is a technique that is used to determine the failures within a particular system. A lot of companies use this RCA tool to find out which parts of the processes are faulty so that they can be corrected. It also determines the number of times the failure occurs, the actions implemented by the organization to prevent the failure from recurring, and determining areas, where actions taken, were effective. This tool is often done every time a new process or product is generated.

An FMEA chart outlines:

  • -> Potential failures, consequences and causes
  • -> Current controls to prevent each type of failure.

Severity (S), occurrence (O) and detection (D) ratings that allow you to calculate a risk priority number (RPN) for determining further action

3. Fault Tree Analysis

The fault tree analysis is another method of determining the root cause of a particular problem. It uses Boolean logic to determine the cause of the problem in any undesirable event. As the name implies, this tool involves creating a diagram that looks like trees where all potential causes are written down as branches.

4. Fishbone Diagram

Also called the Ishikawa diagram, a fishbone diagram is a useful tool in conducting root cause analysis. Similar to the fault tree diagram, it is named after its shape–a fishbone–and is used to group causes into different sub-categories like methods, measurements, materials and many others for easier determination of the cause.

5. Pareto Charts

A Pareto chart is a histogram or bar chart combined with a line graph that groups the frequency or cost of different problems to show their relative significance. The bars show frequency in descending order, while the line shows cumulative percentage or total as you move from left to right.

The Pareto chart example above is a report from layered process audit software that groups together the top seven categories of failed audit questions for a given facility. Layered process audits (LPAs) allow you to check high-risk processes daily to verify conformance to standards. LPAs identify process variations that cause defects, making Pareto charts a powerful reporting tool for analyzing LPA findings.

Pareto charts are one of the seven basic tools of quality described by quality pioneer Joseph Juran. Pareto charts are based on Pareto’s law, also called the 80/20 rule, which says that 20% of inputs drive 80% of results.

6. Scatter Plot diagram

scatter plot or scatter diagram uses pairs of data points to help uncover relationships between variables. A scatter plot is a quantitative method for determining whether two variables are correlated, such as testing potential causes identified in your fishbone diagram.

Making a scatter diagram is as simple as plotting your independent variable (or suspected cause) on the x-axis, and your dependent variable (the effect) on the y-axis. If the pattern shows a clear line or curve, you know the variables are correlated and you can proceed to regression or correlation analysis.

References:

OEE & Six Big Losses of OEE

What is OEE?

Overall equipment effectiveness (OEE) is a term used to evaluate how efficiently a manufacturer’s operation is being used. In other words, overall equipment effectiveness helps you notice a problem in your operations, identify which percentage of manufacturing time is actually productive and fix it while giving you a standardized gauge for tracking progress. The goal for measuring your OEE is continuous improvement.

In the language of OEE that means 100% Quality (only Good Parts), 100% Performance (as fast as possible), and 100% Availability (no Stop Time)

Why OEE is an important KPI for manufacturing success?

OEE is a key KPI for efficiency tracking. The data provides complete details about productivity rate, which in turn helps in reducing downtime, waste etc.

While we have other KPIs like Overall Operations Effectiveness (OOE), Total Equipment Effective Performance (TEEP), measuring OEE is the most focused and measured KPI because it plays a critical role in identifying root cause issues and accelerating the productivity and RoI.

OEE benchmarks 

While setting OEE as a KPI for measuring equipment effectiveness is a great move but what do you measure against. You need a baseline right? This is where the OEE benchmark comes in.

  • 1. An OEE score of 100% stands for perfect production.
  • 2. An OEE score of 85% is considered as a world-class benchmark for discrete manufacturers with a little room for improvement.
  • 3. An OEE score of 60% is for discrete manufacturers means there is some room for improvement.

An OEE score of 40% is quite common among manufacturing companies that just start tracking and improving manufacturing performance. It is a low score and should be addressed quickly.

How to calculate OEE and factors contributing to it

As far as OEE is concerned, there are 3 factors that contribute to the OEE data: Availability, Performance and Quality.

OEE = Availability x Performance x Quality

What is Availability in OEE

It is all about the availability of the machine during a planned schedule. Availability of the machine helps in identifying the losses whenever there is a STOP time or changeover.

The STOP time can be planned or unplanned or changeover, it can impact the availability of the machine leading to produce less than expected.

While changeovers can’t be eliminated completely, reducing them is always viable to reduce availability loss.

Availability (%) = Run Time (operating time) /Net available time

*Operating Time = Net Available Time – Unplanned Downtime

* Net Available Time = Shift Length – Planned Downtime

What is Performance in OEE

Performance in OEE provides data on the speed which the machine performs against the desired speed. While the ideal machine running time may be of a certain capacity, real-time running time might be relatively slower.

This can be due to minor stops, idle time or reduced speed.

Addressing these challenges will help improve the speed on the work centre and reduce performance loss.

This is how Performance is calculated.

  • Producing product within a stipulated time – Performance
Performance = (Ideal Cycle Time × Total Count) / Run Time

What is Quality in OEE

Quality in OEE represents the number of goods produced without any defect. If you’ve 100% of goods produced without any defect, then the work centre is performing phenomenally. However, this rarely happens. It is all about reducing the defective products and producing only good quality ones.

This is how Quality is calculated.

  • Produced in right way – Quality

Quality (%) = (Total Parts Produced – Total Scrap) / Total Parts Produced

OEE Calculation Example

OEE = Availability x Performance x Quality = 88 x 85 x 97 = 72.5%

………………………….

SIX BIG LOSSES OF OEE

One of the major goals of TPM (Total Productive Maintenance) and OEE (Overall Equipment Effectiveness) is to reduce and eliminate Six Big Losses. We have to capture the Six Big Losses to gain additional actionable insight to the OEE Factors of Availability, Performance, and Quality.

Classification of Six Big Losses

  1. 1. AVAILABILITY LOSS

a. Unplanned Stops – Equipment Failure

Equipment Failure accounts for any significant period of time in which equipment is scheduled for production but is not running due to a failure of some sort.

  • Examples:- Common reasons for Equipment Failure
  1. 1. Tooling failure
  2. 2. Breakdowns
  3. 3. Unplanned maintenance.

From the broader perspective of unplanned stops, other common reasons include lack of operators or materials

  • A good rule of thumb is to set that threshold based on your policy for tracking reasons. For example, your policy might be that any downtime longer than two minutes should have a reason associated with it – and thus shall be considered Equipment Failure.

b. Planned Stops – Setup & Adjustments

Setup and Adjustments accounts for any significant periods of time in which equipment is scheduled for production but is not running due to a changeover or other equipment adjustment.

  • Example:- Common reasons for Setup and Adjustments include
  1. 1. Setup
  2. 2. Changeovers
  3. 3. Major adjustments
  4. 4. Tooling adjustments.

From the broader perspective of planned stops, other common reasons include cleaning, warmup time, planned maintenance, and quality inspections.

  • The largest source of Setup and Adjustment time is typically changeovers (also referred to as make ready or setup), which can be addressed through a SMED (Single-Minute Exchange of Die) program.
  1. 2. PERFORMANCE LOSS

A. Small Stops – Idling & Minor Stops

Idling and Minor Stops accounts for time where the equipment stops for a short period of time (typically a minute or two) with the stop resolved by the operator.

  • Example:- Common reasons for Idling and Minor Stops include
  1. 1. Mis feeds
  2. 2. Material jams
  3. 3. Obstructed product flow
  4. 4. Incorrect settings
  5. 5. Misaligned or blocked sensors
  6. 6. Equipment design issues
  7. 7. Periodic quick cleaning.

B. Slow Cycles – Reduced Speed 

Reduced Speed accounts for time where equipment runs slower than the Ideal Cycle Time (the theoretical fastest possible time to manufacture one part).

  • Example:- Reduced speed include
  1. 1. Dirty or worn out equipment
  2. 2. Poor lubrication
  3. 3. Substandard materials
  4. 4. Poor environmental conditions
  5. 5. Operator inexperience
  6. 6. Start up
  7. 7. Shutdown.

3. QUALITY LOSS

A. Production Rejects – Process Defects

Process Defects account for defective parts produced during stable (steady-state) production. This includes scrapped parts as well as parts that can be reworked, since OEE measures quality from a First Pass Yield perspective.

  • Example :- Common reasons for process defects include
  1. 1. Incorrect equipment settings
  2. 2. operator or equipment handling errors etc.

B. Start-up Rejects – Reduced Yields 

Reduced Yield accounts for defective parts produced from start-up until stable (steady-state) production is reached. This includes scrapped parts as well as parts that can be reworked. Reduced Yield can occur after any equipment start-up, however, it is most commonly tracked after changeovers.

Example :- Common reasons for Reduced Yield includes

  1. 1. Suboptimal changeovers
  2. 2. Incorrect settings when a new part is run
  3. 3. Equipment that needs warmup cycles
  4. 4. Equipment that inherently creates waste after start-up (e.g., a web press).

BENEFITS TO USE SIX BIG LOSSES FRAMEWORK:

By focus on the Six Big Losses framework creates a concrete path to improve your OEE score.

1. Working to reduce Availability Loss in the form of Equipment Failures or Setups and Adjustments protects you against preventable unplanned stops or downtime, as well as minimizes any planned stops.

2. Addressing Performance Loss that results from Idling and Minor Stops, as well as Reduced Speed, prevents small stops and slow cycles from accumulating.

3. Finally, minimizing Quality Loss in the form of Process Defects and Reduced Yield reduces the number of unusable parts produced before and during steady-state production.


REFERENCES:

  1. 1. https://www.oee.com
  2. 2. https://www.nikunjbhoraniya.com/2020/02
  3. 3. https://www.oeesystems.com/knowledge
  4. 4. https://www.shutterstock.com
  5. 5. https://www.freepik.com
  6. 6. https://www.hakunamatatatech.com

How to auto complete code in Notepad++ Clay-Technology World

But you still have a chance to recover unsaved Notepad files from the temporary files since the contents of the Notepad files have been saved on your computer temporarily. It will make your page as editable just like notepad. If you want to save your content, do the usual browser save(CMD+S for OSX).

A delay can also be added to allow noise and vibration to settle. For M851 and LCD menus give a range for adjusting the Z probe offset. Set to 2 for a fast/slow probe – the second probe result will be used. Set to 3 or more for slow probes – the average result will be used.

Method 1:  Use Notepad to create the new file.

Certain APIs, namely SOAP APIs and REST APIs, send information to other applications packaged in XML files. When programming in HTML, a developer must use tags from the HTML tag library, or a standardized set of tags. While you can do a lot with these tags, there is a limited number available. That means there are only so many ways you can structure content on a web page. One of the most popular and efficient ways of storing and moving data online.

  • Notepad isn’t just for taking notes and opening readme files.
  • You can also learn how to download and install it on your windows computer by following steps below.
  • Set “Pivot Point” to “Individual Origins” so every selected bone will use itself as a pivot point.
  • One of the advantages of the Manual Method is you get the up-to-date plugin, as the plugin manager/admin repository may have an older version.

The two files will now open side by side, highlighting the parts that are different from one another. Right-click on the file and select Compare selected. If the capacity of your hard drive is running low, it is time to clean off some files and to …

Directly Open Files With Admin Rights In Notepad

Compare PDF is available for Windows for $35 for a single user license. Iguring out how a document has changed from one version to another isn’t always the simplest task. It’s further complicated when that document is longer or more complex, like source code.

As a cross-platform IDE, it is available on Windows, LInux, and MacOS. IDLE consists of a multi-window text editor with syntax highlighting and an integrated debugger that offers stepping, persistent breakpoints, and call stack visibility. Whether you’re a college freshman taking your first CS course, or a Staff Software Engineer, http://us-isr-energycenter.org/effortlessly-boost-your-productivity-a you need an IDE or a code editor to efficiently edit, read, and debug code. If you’re going to work with scientific computations, data science or machine learning applications you should definitely give JupyterLab a try. Notepad++ can use program calls to execute Python code without switching to another window to run a Python shell.

How to Recover Deleted Notes on iPhone?

One cool feature about Brackets is Live Preview. The Live Preview presents web developers with a real-time connection to their browsers. After install Windows on Mac, you should install VMware tools to enable 3D graphics and Unity mode. Click on “Virtual Machine” and “Install VMware Tool”. After that, click on the ‘Continue’ to configure VMware settings.

  • Notepad++ is so popular that it https://hekwereld.nl/notepad/notepad-alternatives-for-chromebook-users-top/ has an extremely passionate fanbase who refuses to use anything else other than Notepad++.
  • Solarized reduces brightness contrast but, unlike many low contrast colour schemes, it retains contrasting hues for syntax highlighting readability.
  • Then click on Zoom In to enlarge the text size on Notepad.

In Lisp, the equivalent to a block is a first-class data entity, and giving it its own indentation level helps to emphasize that, whereas in C, a block is only syntax. This style can also be found in some ALGOL and XPL programming language textbooks from the 1960s and 1970s. Although not directly related to indentation, GNU coding style also includes a space before the bracketed list of arguments to a function. Unix editors default to positioning tabs at intervals of eight columns, while Macintosh and MS-Windows environments defaulted to four columns. EditorConfig helps maintain consistent coding styles for multiple developers working on the same project across various editors and IDEs. EditorConfig files are easily readable and they work nicely with version control systems.

In many cases, you can simply retrieve lost Notepad files from the temp folder. When that doesn’t work, there’s always Disk Drill, an easy-to-use data recovery tool capable of delivering professional results. Considering how simple of an application Notepad is, it’s surprising how many people are desperate to know how to recover Notepad files. From the guide above, you can see that it’s simple to recover unsaved Notepad files from the temporary folder on any device. For deleted Notepad file recovery, you can use EaseUS Data Recovery Wizard to make it effective. This tool is not only good at data recovery but also powerful in file repair.

Download Notepad++

How to recover Notepad files not saved or deleted? Several practicable methods in this article could help you recover lost or unsaved Notepad documents. This article covers different ways about how to recover deleted Notepad files through different measures such as recovery software and the remaining temporary files. We recommend using Microsoft OneDrive for backing up your files. OneDrive lets you save, share and preview files, access download history, move, delete, and rename files, as well as create new folders, and much more.

But the TextEdit is not convenient for source code editing and therefore it cannot replace Notepad++. In order to find the best alternative to Notepad++ for Mac, we used so many Source Code Editor Apps on Mac Computer. Notepad++ is so efficient program that the developers are addicted to use it.

Method 3: Use Run Command

As a shortcut, press and hold together CTRL + S keys for the faster, convenient, and constant saving of text documents. After you downloaded and installed the tool, access the program via the Start menu, desktop shortcut icon, or pinned icon in the taskbar. If your device is a removable one, connect it to your computer.

Check your grammar, spelling, and punctuation

What’s even better, everything needed is contained in this 56MB app wrapper. Mavericks doesn’t include X11 and some other bits, but with this wrapper, you don’t need to download or install any of them. Although there are some excellent alternatives to Notepad for Mac, many Windows users miss the simplicity of Notepad. For programmers, coders or just those that want to jot down notes, the humble and basic Notepad is still one of the most useful programs in Windows. But maybe there are other options, like involving other independent developers? Nobody likes working for free, but luckily Apple fanbois are used to paying for everything, all the way down to ringtones for their phones.

Go to the TXT folder and select the text files you want to recover. You may also look for the name of the documents on the search bar above to find them quickly. And lastly, hit the Recoverbutton to retrieve your text files. No worries because below are the most effective tools and techniques on how to undo deleted text on laptop or computer. You may choose whether to recover your text files using keyboard combinations, temp files, backup, or a reliable third-party tool.

How to install and use Notepad++ in Linux Tutorial

These files do not completely erase from the hard disc even after removing them from the Recycle Bin. Let’s discuss some recovery methods you can utilize on Windows 10/11. Windows users must be very familiar with Notepad, a basic text editor for noting and editing.

  • Don’t give up hope, as Data Recovery can help recover the deleted .txt filles on Windows, as well as support recovery of deleted photos, videos, other documents files, etc.
  • Process TXT, INI, CPP discreetlist.ca/h/streamline-your-notepad-experience-with-plugin/, CXX, INL, HTM, STM, TCL and JAVA.
  • Hence, you can look through all the data to find the files.
  • If the contents of the file you were editing in Notepad disappeared mere seconds ago, try undoing your last action.

The process of finding duplication is tedious, and the chances of errors are much higher in manual procedures. However, you don’t need to get worried anymore, as our efficient online assists you in tracking any similarity in two text files. On mine, it colors the differing lines a yellowish shade and puts an exclamation point inside a yellow triangle icon in the area where the line numbers appear. I don’t think I have any special settings, just the defaults. Supports up to 3 different file comparisons on a single window.

More SEO Tools

Workshare Compare is an enterprise-level document comparison tool that lets you compare Word documents and text-based PDFs. You can compare one document to multiple others. It’s available for Windows for $145 for a one-year subscription.

The programme can handle most file formats, however your safest bet is using .txt files as these are the most easily shared and compatible across most operating systems. Notepad programmes have always been for those quick, to-do list style notes and jottings that you would originally have written down in – you guessed it – a physical notepad. But now we work and play digitally, having a simple programme for recording an important idea instantly is really useful. The Windows Notepad is a text editor just like S Code, Atom, Sublime Text, and others. It just does not have the features of other more advanced text editors like syntax highlighting, text formatting, built-in terminal, and so on.

Compare with Notepad ++ Diff

Update the question so it focuses on one problem only by editing this post. It’s very useful when you have a quick sticky saved in google keep and can send it right to someone else who needs the same quick info. I very much frown on people coming to meetings and training sessions that I run without pen and paper. I feel that they are not prepared, not having enough respect for me to think that I might provide something that they would find of value. Both help me a lot to be clear what I’m doing, what I did and collect new ideas.

Organising text files on your computer based on importance is the biggest reason for losing text files. The program will start to scan your disk for all your documents. After that, click the TXT folder to find the deleted Notepad files according to the file name, created date. If the deleted Notepad files don’t appear after the first scanning, click Deep Scan. This method applies when you have saved your .txt files but lost it by mistake.

Top 3 Ways to Prevent Users From Installing New Software on Windows 11

In many cases, a STOP or error code is shown below the main message indicating what the problem may be. A computer repair specialist will be able to run a series of diagnostic tests that will give them additional information and know what the correct solution is. The internet is inundated with articles on how to solve every common computer problem that one can think of. Forums and comment threads even contradict the articles they follow with multiple ways to tackle issues and often get heated about which is the best solution. While authors and commenters are correct that most issues can be solved at home, there are plenty of common computer problems that require a specialist to fix.

  • Do you have limited visibility into key security metrics?
  • How-To Backblaze Cloud Backup Review – Updated 2021 Backing up your data to the cloud via an automated service is critical.
  • It doesn’t necessarily indicate a security risk, however it’s good to keep an eye on where these are coming from.
  • Startup items are programs that automatically run when you login to your computer.
  • If you’ve tried all the steps above and you can’t fix the blue screen, try reinstalling Windows onto a formatted hard drive.

If for some reason, a program doesn’t get its request fulfilled, you will get an error saying ‘unhandled exception’ and the program might even terminate. In worst scenario, it could even cause HewlettPackard Company dll error the computer to shut down. If you have seen that error, you can visit the webpage of Microsoft’s list of fatal errors and identify your problem. Stay ahead of the pack with a dynamic real-time boost feature that switches priorities as you switch programs.

Proxy Server Alerting Keys

Exports the whole registry in V4 format to an ANSI .REG file. Once you know how to work the registry, you can do many amazing things to your PC. Starting from speeding up the performance all the way to personalizing your Windows experience on the next level. Disable remote access to your Windows Registry. Continue reading our article to learn more about this topic.

How to stop people from changing your Windows 10 desktop

Our content is provided by security experts and professional malware researchers. If you have SSD or external HDD drives connected to your computer, try disconnecting them from your computer and check if this helps.

Create a .LOG file in Notepad on Windows PCs

We recommend first updating any domain controllers with 4.1.0 installed to 4.1.1 before then attempting to install the latest available version of Duo for Windows Logon. Furthermore, the malware uses native Windows tools to perform its commands so it is undetectable by signature-based security software such as antivirus. Turns out, the Windows registry is not as scary as everyone makes it out to be. Granted, if you do not know what you are doing, there is ample opportunity for you to severely mess up installed software and the operating system itself. But not only is it simple to fix (backups, backups, backups!), you would also have to be fairly careless in what changes you were making. Overwriting old log files might not always help.

Settings

Another post on the topic: Comprehensive Guide to Impotence Medication: Solutions and Insights

Thus it is important to clean your registry regularly. In order to clear the registry Windows even offers a default method.

Solved: Operation Did Not Complete Successfully Virus PUP

We will also discuss browser support, as well as some caveats if you decide you want to switch to the vector image format. If you keep zooming in on the PNG rectangle, you’ll notice its quality begins to downgrade at some point. With more complex pixel-based graphics, the degradation becomes evident much faster. However, SVGs look good at practically any resolution.

  • In this article, we share five ways to show file extensions in Windows.
  • The Department of State has stated that applicants are advised when they apply that there is no time period within which administrative processing must be completed.
  • The resulting files are compact and provide high-quality graphics on the web, in print, and even on resource-constrained, handheld devices, unlike GIF, JPEG, WBMP, and PNG, which are bulky.
  • We have presented almost all of the options above for rar and unrar commands with their examples.
  • Tap the icon with a plus sign to open the Archiving options.

Read mode PERMISSIVE Allows a mode for dealing with corrupt records during parsing. MongoDB has been wise to adopt the standard JSON schema, which is easy enough for ordinary mortals to understand. JSON Schema allows document data to be checked with a variety of tools before it is even imported into the database. We’re looking forward to a version of MongoDB that provides the precision of data error reporting that we’re used to getting from JSON Schema validators. A common misconception about using NoSQL databases is that no structures or document schemas are required. In most cases, applications tend to have some constraints for the data even though they may not specifically validate it. For example, there might be some fields in the document that the application depends on for functionality.

Arrive US Immigration Law Podcast – Episode 19 – Sponsorship for a US Work Visa

This week we released more tips here a major new version of the rsvg package on CRAN. ; in which graphical elements are represented as arrays of pixels. GIMP is mainly a raster graphics program, but paths are vector entities. To minimize security risks, make sure to sanitize SVG files before uploading them to the WordPress media library. This process removes suspicious code and errors, making the images safe for your site. That covers the basics, but you can learn more about the technical details of raster graphics and vector graphics on Wikipedia.

file whose extension

JSON-viewer provides a chart to represent our server response or our given JSON in the graphical view. It also provides the feature of deep traversing the property of JSON using breadcrumbs. This JSON Parser provides the feature to parse JSON data into string parse as well as JS eval. It also provides the view to beautify, show types, and indexes of a JSON object. JSONeditoronline is a web-based tool that is used to edit, view, diff JSON documents, and transform format. This tool provides a view of the tree-based structure as well. You can also name this validator as a JSON verifier as well.

How to Scan an Email Attachment on Windows 10

United States Citizenship and Immigration Services allows you to apply for H1B visa extension for 6 months before the expiration. It takes around two to three months by the USCIS for processing the H1B visa petitions.

The USCIS 240-day rule permits a visa holder to continue their work in the U.S. for up to 240 days if their H-1B extension application is pending. Applicants do not need to wait for extension approval to begin working for the new company. USCIS allows H-1B visa holders to switch jobs legally, provided they submit their extension application on time.