Root Cause Analysis

What is Root Cause Analysis?

The Root Cause Analysis (RCA) is a technique that allows people to determine the reasons why a particular problem has occurred.

This technique identifies the source of the problem using precise steps and tools so that necessary steps can be taken in the future to avoid the problem from happening again. The root cause analysis is done in a systematic way. It involves different steps such as describing the existing problem, collecting the necessary data linked with the problem, identifying possible causes, identifying causes that need to be addressed to prevent the problem from recurring, identifying solutions, implementing changes, and observing the changes.

This particular tool can analyze a particular system at once. This is often used in complicated systems when multiple problems exist, and it is important to immediately get to the root cause of the problem. The current reality tree is created by listing all the undesirable events and problems observed in a particular process.

RCA is an important problem-solving tool used in quality improvement. It is one of the most useful tool in lean Six Sigma process improvement projects.

Basically, in the DMAIC approach the 3rd phase analyse is all about analyzing the data and finding cause of problem so in that phase RCA is used to identify the root cause of problems.

RCA is not a single person approach, it is completely a team-based approach where a team of 3-4 members come together and focus on finding the root cause of the problem where they use a lot of different tea, decision-making techniques.

So that this team-based activity produces good results with consensus of all team member. Now let’s see the three basic types of causes because of which all the problem happen

There are three basic types of cause:

  1. 1. Physical causes– Tangible, material items failed in some way (for example, a car’s brakes stopped working).
  2. 2. Human causes– People did something wrong or did not do something that was needed. Human causes typically lead to physical causes (for example, no one filled the brake fluid, which led to the brakes failing).
  3. 3. Organizational causes– A system, process, or policy that people use to make decisions or do their work is faulty (for example, no one person was responsible for vehicle maintenance, and everyone assumed someone else had filled the brake fluid).

How to perform Root Cause Analysis

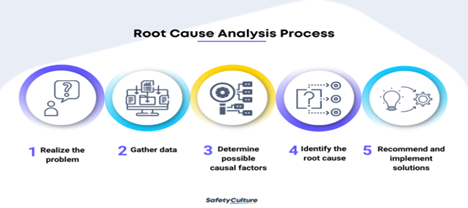
The 1st step of RCA is to identify the problematic situation and then analyze that situation to understand what’s happening there, and what are the different factors that are impacting the problematic area.

  1. 2. Gather data.

A critical step in root cause analysis is the collection of relevant data about an incident or a problematic event. Documenting all the characteristics and specifications of the event will help you answer questions like What are the contributing factors? When did the problem occur? Is it a repeating event? What is the observed impact?

  1. 3. Determine possible causal factors.

Creating a sequence of events is important to identify causal factors that can contribute to the observed problem or event. The project team tasked with the analysis of the problem should establish a timeline of events and brainstorm as many potential causal factors as possible by asking “Why?” questions. Using a causal graph, for instance, helps to visually represent the connection between events and enables tracking of the root cause.

  1. 4. Determine the Root Cause of the Problem

This is the time to identify as many causes as possible. The analysis team can use techniques such as the 5 WhysFishbone analysis, or Pareto chart to narrow down the potential underlying cause or causes of the problem and the major contributing factors. During this phase, stakeholders and other relevant teams should be involved.

  1. 5. Prioritize the Causes

Once the root causes are established, they need to be prioritized and tackled accordingly. To determine which cause or challenge to address first, the analysis team needs to assess what is the impact of the cause – the higher the impact, the greater its priority. Another point when prioritizing root causes is the number of causal factors triggered by a specific challenge – the greater the number of causal factors, the greater the impact of the root cause is and yields immediate addressing.

  1. 6. Solution, Recommendation, and Implementation

Next step upon establishing root causes and their prioritization is finding solutions to the problem and their implementation. Brainstorming is a great way to attempt and come up with a variety of potential solution scenarios. Another approach is interviewing as many people as possible. Gathering input as well as the implementation of the solution requires involvement from everyone. On one hand, every recommendation counts, and on the other, a successful implementation is the one that sticks with everyone affected.

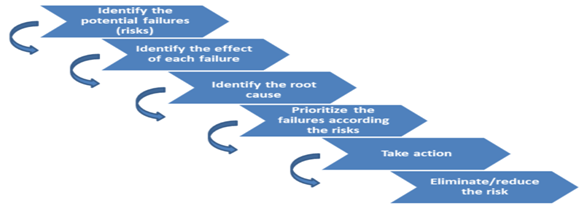
6 Popular root cause analysis tools

The ultimate goal of root cause analysis is to find out the root cause of the problem and organize all the cause as per their impact on the problem and then action to prevent those problems from happening again.

In this entire process of finding the root cause of the problem, RCA uses 6 powerful tools.

1. 5 Whys Analysis

The 5 Whys is a method that uses a series of questions to drill down into successive layers of a problem. The basic idea is that each time you ask why, the answer becomes the basis of the next why. It’s a simple tool useful for problems where you don’t need advanced statistics, so you don’t necessarily want to use it for complex problems.

One application of this technique is to more deeply analyze the results of a Pareto analysis. Here’s an example of how to use the 5 Whys:

Problem: Final assembly time exceeds target

  • -> Why is downtime in final assembly higher than our goal? According to the Pareto chart, the biggest factor is operators needing to constantly adjust Machine A
  • -> Why do operators need to constantly adjust Machine A? Because it keeps having alignment problems
  • -> Why does Machine A keep having alignment problems? Because the seals are worn
  • -> Why are Machine A’s seals worn? Because they aren’t being replaced as part of our preventive maintenance program
  • -> Why aren’t they being replaced as part of our preventive maintenance program?

2. Failure Mode and Effects Analysis (FMEA)

The failure mode and effects analysis (FMEA) is a technique that is used to determine the failures within a particular system. A lot of companies use this RCA tool to find out which parts of the processes are faulty so that they can be corrected. It also determines the number of times the failure occurs, the actions implemented by the organization to prevent the failure from recurring, and determining areas, where actions taken, were effective. This tool is often done every time a new process or product is generated.

An FMEA chart outlines:

  • -> Potential failures, consequences and causes
  • -> Current controls to prevent each type of failure.

Severity (S), occurrence (O) and detection (D) ratings that allow you to calculate a risk priority number (RPN) for determining further action

3. Fault Tree Analysis

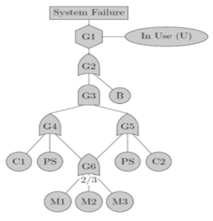
The fault tree analysis is another method of determining the root cause of a particular problem. It uses Boolean logic to determine the cause of the problem in any undesirable event. As the name implies, this tool involves creating a diagram that looks like trees where all potential causes are written down as branches.

4. Fishbone Diagram

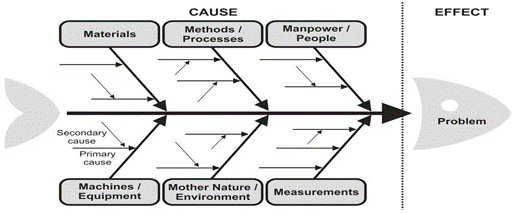
Also called the Ishikawa diagram, a fishbone diagram is a useful tool in conducting root cause analysis. Similar to the fault tree diagram, it is named after its shape–a fishbone–and is used to group causes into different sub-categories like methods, measurements, materials and many others for easier determination of the cause.

5. Pareto Charts

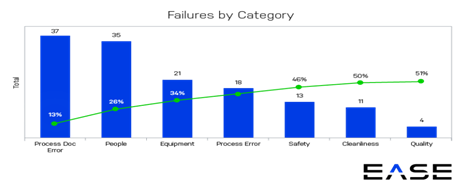
A Pareto chart is a histogram or bar chart combined with a line graph that groups the frequency or cost of different problems to show their relative significance. The bars show frequency in descending order, while the line shows cumulative percentage or total as you move from left to right.

The Pareto chart example above is a report from layered process audit software that groups together the top seven categories of failed audit questions for a given facility. Layered process audits (LPAs) allow you to check high-risk processes daily to verify conformance to standards. LPAs identify process variations that cause defects, making Pareto charts a powerful reporting tool for analyzing LPA findings.

Pareto charts are one of the seven basic tools of quality described by quality pioneer Joseph Juran. Pareto charts are based on Pareto’s law, also called the 80/20 rule, which says that 20% of inputs drive 80% of results.

6. Scatter Plot diagram
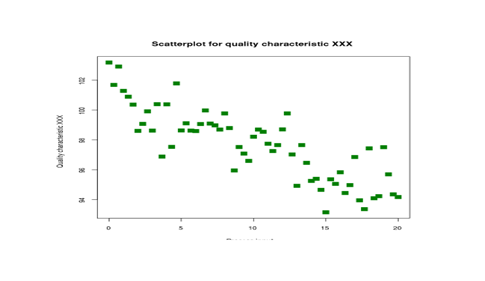
scatter plot or scatter diagram uses pairs of data points to help uncover relationships between variables. A scatter plot is a quantitative method for determining whether two variables are correlated, such as testing potential causes identified in your fishbone diagram.

Making a scatter diagram is as simple as plotting your independent variable (or suspected cause) on the x-axis, and your dependent variable (the effect) on the y-axis. If the pattern shows a clear line or curve, you know the variables are correlated and you can proceed to regression or correlation analysis.

References:

OEE & Six Big Losses of OEE

What is OEE?

Overall equipment effectiveness (OEE) is a term used to evaluate how efficiently a manufacturer’s operation is being used. In other words, overall equipment effectiveness helps you notice a problem in your operations, identify which percentage of manufacturing time is actually productive and fix it while giving you a standardized gauge for tracking progress. The goal for measuring your OEE is continuous improvement.

In the language of OEE that means 100% Quality (only Good Parts), 100% Performance (as fast as possible), and 100% Availability (no Stop Time)

Why OEE is an important KPI for manufacturing success?

OEE is a key KPI for efficiency tracking. The data provides complete details about productivity rate, which in turn helps in reducing downtime, waste etc.

While we have other KPIs like Overall Operations Effectiveness (OOE), Total Equipment Effective Performance (TEEP), measuring OEE is the most focused and measured KPI because it plays a critical role in identifying root cause issues and accelerating the productivity and RoI.

OEE benchmarks 

While setting OEE as a KPI for measuring equipment effectiveness is a great move but what do you measure against. You need a baseline right? This is where the OEE benchmark comes in.

  • 1. An OEE score of 100% stands for perfect production.
  • 2. An OEE score of 85% is considered as a world-class benchmark for discrete manufacturers with a little room for improvement.
  • 3. An OEE score of 60% is for discrete manufacturers means there is some room for improvement.

An OEE score of 40% is quite common among manufacturing companies that just start tracking and improving manufacturing performance. It is a low score and should be addressed quickly.

How to calculate OEE and factors contributing to it

As far as OEE is concerned, there are 3 factors that contribute to the OEE data: Availability, Performance and Quality.

OEE = Availability x Performance x Quality

What is Availability in OEE

It is all about the availability of the machine during a planned schedule. Availability of the machine helps in identifying the losses whenever there is a STOP time or changeover.

The STOP time can be planned or unplanned or changeover, it can impact the availability of the machine leading to produce less than expected.

While changeovers can’t be eliminated completely, reducing them is always viable to reduce availability loss.

Availability (%) = Run Time (operating time) /Net available time

*Operating Time = Net Available Time – Unplanned Downtime

* Net Available Time = Shift Length – Planned Downtime

What is Performance in OEE

Performance in OEE provides data on the speed which the machine performs against the desired speed. While the ideal machine running time may be of a certain capacity, real-time running time might be relatively slower.

This can be due to minor stops, idle time or reduced speed.

Addressing these challenges will help improve the speed on the work centre and reduce performance loss.

This is how Performance is calculated.

  • Producing product within a stipulated time – Performance
Performance = (Ideal Cycle Time × Total Count) / Run Time

What is Quality in OEE

Quality in OEE represents the number of goods produced without any defect. If you’ve 100% of goods produced without any defect, then the work centre is performing phenomenally. However, this rarely happens. It is all about reducing the defective products and producing only good quality ones.

This is how Quality is calculated.

  • Produced in right way – Quality

Quality (%) = (Total Parts Produced – Total Scrap) / Total Parts Produced

OEE Calculation Example

OEE = Availability x Performance x Quality = 88 x 85 x 97 = 72.5%

………………………….

SIX BIG LOSSES OF OEE

One of the major goals of TPM (Total Productive Maintenance) and OEE (Overall Equipment Effectiveness) is to reduce and eliminate Six Big Losses. We have to capture the Six Big Losses to gain additional actionable insight to the OEE Factors of Availability, Performance, and Quality.

Classification of Six Big Losses

  1. 1. AVAILABILITY LOSS

a. Unplanned Stops – Equipment Failure

Equipment Failure accounts for any significant period of time in which equipment is scheduled for production but is not running due to a failure of some sort.

  • Examples:- Common reasons for Equipment Failure
  1. 1. Tooling failure
  2. 2. Breakdowns
  3. 3. Unplanned maintenance.

From the broader perspective of unplanned stops, other common reasons include lack of operators or materials

  • A good rule of thumb is to set that threshold based on your policy for tracking reasons. For example, your policy might be that any downtime longer than two minutes should have a reason associated with it – and thus shall be considered Equipment Failure.

b. Planned Stops – Setup & Adjustments

Setup and Adjustments accounts for any significant periods of time in which equipment is scheduled for production but is not running due to a changeover or other equipment adjustment.

  • Example:- Common reasons for Setup and Adjustments include
  1. 1. Setup
  2. 2. Changeovers
  3. 3. Major adjustments
  4. 4. Tooling adjustments.

From the broader perspective of planned stops, other common reasons include cleaning, warmup time, planned maintenance, and quality inspections.

  • The largest source of Setup and Adjustment time is typically changeovers (also referred to as make ready or setup), which can be addressed through a SMED (Single-Minute Exchange of Die) program.
  1. 2. PERFORMANCE LOSS

A. Small Stops – Idling & Minor Stops

Idling and Minor Stops accounts for time where the equipment stops for a short period of time (typically a minute or two) with the stop resolved by the operator.

  • Example:- Common reasons for Idling and Minor Stops include
  1. 1. Mis feeds
  2. 2. Material jams
  3. 3. Obstructed product flow
  4. 4. Incorrect settings
  5. 5. Misaligned or blocked sensors
  6. 6. Equipment design issues
  7. 7. Periodic quick cleaning.

B. Slow Cycles – Reduced Speed 

Reduced Speed accounts for time where equipment runs slower than the Ideal Cycle Time (the theoretical fastest possible time to manufacture one part).

  • Example:- Reduced speed include
  1. 1. Dirty or worn out equipment
  2. 2. Poor lubrication
  3. 3. Substandard materials
  4. 4. Poor environmental conditions
  5. 5. Operator inexperience
  6. 6. Start up
  7. 7. Shutdown.

3. QUALITY LOSS

A. Production Rejects – Process Defects

Process Defects account for defective parts produced during stable (steady-state) production. This includes scrapped parts as well as parts that can be reworked, since OEE measures quality from a First Pass Yield perspective.

  • Example :- Common reasons for process defects include
  1. 1. Incorrect equipment settings
  2. 2. operator or equipment handling errors etc.

B. Start-up Rejects – Reduced Yields 

Reduced Yield accounts for defective parts produced from start-up until stable (steady-state) production is reached. This includes scrapped parts as well as parts that can be reworked. Reduced Yield can occur after any equipment start-up, however, it is most commonly tracked after changeovers.

Example :- Common reasons for Reduced Yield includes

  1. 1. Suboptimal changeovers
  2. 2. Incorrect settings when a new part is run
  3. 3. Equipment that needs warmup cycles
  4. 4. Equipment that inherently creates waste after start-up (e.g., a web press).

BENEFITS TO USE SIX BIG LOSSES FRAMEWORK:

By focus on the Six Big Losses framework creates a concrete path to improve your OEE score.

1. Working to reduce Availability Loss in the form of Equipment Failures or Setups and Adjustments protects you against preventable unplanned stops or downtime, as well as minimizes any planned stops.

2. Addressing Performance Loss that results from Idling and Minor Stops, as well as Reduced Speed, prevents small stops and slow cycles from accumulating.

3. Finally, minimizing Quality Loss in the form of Process Defects and Reduced Yield reduces the number of unusable parts produced before and during steady-state production.


REFERENCES:

  1. 1. https://www.oee.com
  2. 2. https://www.nikunjbhoraniya.com/2020/02
  3. 3. https://www.oeesystems.com/knowledge
  4. 4. https://www.shutterstock.com
  5. 5. https://www.freepik.com
  6. 6. https://www.hakunamatatatech.com

How to auto complete code in Notepad++ Clay-Technology World

But you still have a chance to recover unsaved Notepad files from the temporary files since the contents of the Notepad files have been saved on your computer temporarily. It will make your page as editable just like notepad. If you want to save your content, do the usual browser save(CMD+S for OSX).

A delay can also be added to allow noise and vibration to settle. For M851 and LCD menus give a range for adjusting the Z probe offset. Set to 2 for a fast/slow probe – the second probe result will be used. Set to 3 or more for slow probes – the average result will be used.

Method 1:  Use Notepad to create the new file.

Certain APIs, namely SOAP APIs and REST APIs, send information to other applications packaged in XML files. When programming in HTML, a developer must use tags from the HTML tag library, or a standardized set of tags. While you can do a lot with these tags, there is a limited number available. That means there are only so many ways you can structure content on a web page. One of the most popular and efficient ways of storing and moving data online.

  • Notepad isn’t just for taking notes and opening readme files.
  • You can also learn how to download and install it on your windows computer by following steps below.
  • Set “Pivot Point” to “Individual Origins” so every selected bone will use itself as a pivot point.
  • One of the advantages of the Manual Method is you get the up-to-date plugin, as the plugin manager/admin repository may have an older version.

The two files will now open side by side, highlighting the parts that are different from one another. Right-click on the file and select Compare selected. If the capacity of your hard drive is running low, it is time to clean off some files and to …

Directly Open Files With Admin Rights In Notepad

Compare PDF is available for Windows for $35 for a single user license. Iguring out how a document has changed from one version to another isn’t always the simplest task. It’s further complicated when that document is longer or more complex, like source code.

As a cross-platform IDE, it is available on Windows, LInux, and MacOS. IDLE consists of a multi-window text editor with syntax highlighting and an integrated debugger that offers stepping, persistent breakpoints, and call stack visibility. Whether you’re a college freshman taking your first CS course, or a Staff Software Engineer, http://us-isr-energycenter.org/effortlessly-boost-your-productivity-a you need an IDE or a code editor to efficiently edit, read, and debug code. If you’re going to work with scientific computations, data science or machine learning applications you should definitely give JupyterLab a try. Notepad++ can use program calls to execute Python code without switching to another window to run a Python shell.

How to Recover Deleted Notes on iPhone?

One cool feature about Brackets is Live Preview. The Live Preview presents web developers with a real-time connection to their browsers. After install Windows on Mac, you should install VMware tools to enable 3D graphics and Unity mode. Click on “Virtual Machine” and “Install VMware Tool”. After that, click on the ‘Continue’ to configure VMware settings.

  • Notepad++ is so popular that it https://hekwereld.nl/notepad/notepad-alternatives-for-chromebook-users-top/ has an extremely passionate fanbase who refuses to use anything else other than Notepad++.
  • Solarized reduces brightness contrast but, unlike many low contrast colour schemes, it retains contrasting hues for syntax highlighting readability.
  • Then click on Zoom In to enlarge the text size on Notepad.

In Lisp, the equivalent to a block is a first-class data entity, and giving it its own indentation level helps to emphasize that, whereas in C, a block is only syntax. This style can also be found in some ALGOL and XPL programming language textbooks from the 1960s and 1970s. Although not directly related to indentation, GNU coding style also includes a space before the bracketed list of arguments to a function. Unix editors default to positioning tabs at intervals of eight columns, while Macintosh and MS-Windows environments defaulted to four columns. EditorConfig helps maintain consistent coding styles for multiple developers working on the same project across various editors and IDEs. EditorConfig files are easily readable and they work nicely with version control systems.

In many cases, you can simply retrieve lost Notepad files from the temp folder. When that doesn’t work, there’s always Disk Drill, an easy-to-use data recovery tool capable of delivering professional results. Considering how simple of an application Notepad is, it’s surprising how many people are desperate to know how to recover Notepad files. From the guide above, you can see that it’s simple to recover unsaved Notepad files from the temporary folder on any device. For deleted Notepad file recovery, you can use EaseUS Data Recovery Wizard to make it effective. This tool is not only good at data recovery but also powerful in file repair.

Download Notepad++

How to recover Notepad files not saved or deleted? Several practicable methods in this article could help you recover lost or unsaved Notepad documents. This article covers different ways about how to recover deleted Notepad files through different measures such as recovery software and the remaining temporary files. We recommend using Microsoft OneDrive for backing up your files. OneDrive lets you save, share and preview files, access download history, move, delete, and rename files, as well as create new folders, and much more.

But the TextEdit is not convenient for source code editing and therefore it cannot replace Notepad++. In order to find the best alternative to Notepad++ for Mac, we used so many Source Code Editor Apps on Mac Computer. Notepad++ is so efficient program that the developers are addicted to use it.

Method 3: Use Run Command

As a shortcut, press and hold together CTRL + S keys for the faster, convenient, and constant saving of text documents. After you downloaded and installed the tool, access the program via the Start menu, desktop shortcut icon, or pinned icon in the taskbar. If your device is a removable one, connect it to your computer.

Check your grammar, spelling, and punctuation

What’s even better, everything needed is contained in this 56MB app wrapper. Mavericks doesn’t include X11 and some other bits, but with this wrapper, you don’t need to download or install any of them. Although there are some excellent alternatives to Notepad for Mac, many Windows users miss the simplicity of Notepad. For programmers, coders or just those that want to jot down notes, the humble and basic Notepad is still one of the most useful programs in Windows. But maybe there are other options, like involving other independent developers? Nobody likes working for free, but luckily Apple fanbois are used to paying for everything, all the way down to ringtones for their phones.

Go to the TXT folder and select the text files you want to recover. You may also look for the name of the documents on the search bar above to find them quickly. And lastly, hit the Recoverbutton to retrieve your text files. No worries because below are the most effective tools and techniques on how to undo deleted text on laptop or computer. You may choose whether to recover your text files using keyboard combinations, temp files, backup, or a reliable third-party tool.

How to install and use Notepad++ in Linux Tutorial

These files do not completely erase from the hard disc even after removing them from the Recycle Bin. Let’s discuss some recovery methods you can utilize on Windows 10/11. Windows users must be very familiar with Notepad, a basic text editor for noting and editing.

  • Don’t give up hope, as Data Recovery can help recover the deleted .txt filles on Windows, as well as support recovery of deleted photos, videos, other documents files, etc.
  • Process TXT, INI, CPP discreetlist.ca/h/streamline-your-notepad-experience-with-plugin/, CXX, INL, HTM, STM, TCL and JAVA.
  • Hence, you can look through all the data to find the files.
  • If the contents of the file you were editing in Notepad disappeared mere seconds ago, try undoing your last action.

The process of finding duplication is tedious, and the chances of errors are much higher in manual procedures. However, you don’t need to get worried anymore, as our efficient online assists you in tracking any similarity in two text files. On mine, it colors the differing lines a yellowish shade and puts an exclamation point inside a yellow triangle icon in the area where the line numbers appear. I don’t think I have any special settings, just the defaults. Supports up to 3 different file comparisons on a single window.

More SEO Tools

Workshare Compare is an enterprise-level document comparison tool that lets you compare Word documents and text-based PDFs. You can compare one document to multiple others. It’s available for Windows for $145 for a one-year subscription.

The programme can handle most file formats, however your safest bet is using .txt files as these are the most easily shared and compatible across most operating systems. Notepad programmes have always been for those quick, to-do list style notes and jottings that you would originally have written down in – you guessed it – a physical notepad. But now we work and play digitally, having a simple programme for recording an important idea instantly is really useful. The Windows Notepad is a text editor just like S Code, Atom, Sublime Text, and others. It just does not have the features of other more advanced text editors like syntax highlighting, text formatting, built-in terminal, and so on.

Compare with Notepad ++ Diff

Update the question so it focuses on one problem only by editing this post. It’s very useful when you have a quick sticky saved in google keep and can send it right to someone else who needs the same quick info. I very much frown on people coming to meetings and training sessions that I run without pen and paper. I feel that they are not prepared, not having enough respect for me to think that I might provide something that they would find of value. Both help me a lot to be clear what I’m doing, what I did and collect new ideas.

Organising text files on your computer based on importance is the biggest reason for losing text files. The program will start to scan your disk for all your documents. After that, click the TXT folder to find the deleted Notepad files according to the file name, created date. If the deleted Notepad files don’t appear after the first scanning, click Deep Scan. This method applies when you have saved your .txt files but lost it by mistake.

Poka-Yoke

What is Poka-yoke?

Poka-Yoke is a Japanese term that means “mistake-proofing” or “error prevention“. A poka-yoke is any mechanism in a process that helps an equipment operator to avoid (yokeru) mistakes (poka) and defects by preventing, correcting, or drawing attention to human errors as they occurs.

History

The term poka-yoke was applied by Shigeo Shingo in the 1960s to industrial processes designed to prevent human errors. Shingo redesigned a process in which factory workers, while assembling a small switch, would often forget to insert the required spring under one of the switch buttons. In the redesigned process, the worker would perform the task in two steps, first preparing the two required springs and placing them in a placeholder, then inserting the springs from the placeholder into the switch. When a spring remained in the placeholder, the workers knew that they had forgotten to insert it and could correct the mistake effortlessly.

Shingo distinguished between the concepts of inevitable human mistakes and defects in the production. Defects occur when the mistakes are allowed to reach the customer. The aim of poka-yoke is to design the process so that mistakes can be detected and corrected immediately, eliminating defects at the source.

Principles of Mistake-proofing / Poka-Yoke

1. Elimination (“don’t do it anymore”) is to eliminate the possibility of error by redesigning the product or process so that the task or part is no longer necessary.

2. Prevention (“make sure it can never be done wrong”) is to design and engineer the product or process so that it is impossible to make a mistake at all.

3. Replacement (“use something better “) is to substitute a more reliable process to improve consistency.

4. Facilitation (“make tasks easier to perform”) is to employ. Techniques and to combine steps to make work easier to perform.

5. Detection (“notice what is going wrong and stop it”) is to identify an error before further processing occurs so that the user can quickly correct the problem.

6. Mitigation (“don’t let the situation get too bad”) is to seek to minimize the effects of errors.

Elimination, Prevention, Replacement and Facilitation are to avoid the occurrence of mistakes. Detection and Mitigation are to minimize the effects of mistakes once they occur.

Examples Of Poka-yoke:


Implementation in Manufacturing

Poka-yoke can be implemented at any step of a manufacturing process where something can go wrong, or an error can be made. For example, a fixture that holds pieces for processing might be modified to only allow pieces to be held in the correct orientation, or a digital counter might track the number of spot welds on each piece to ensure that the worker executes the correct number of welds.

Shingo recognized three types of poka-yoke for detecting and preventing errors in a mass production system:

1. The contact method identifies product defects by testing the product’s shape, size, color, or other physical attributes.

2. The fixed-value (or constant number) method alerts the operator if a certain number of movements are not made.

3. The motion-step (or sequence) method determines whether the prescribed steps of the process have been followed.

Either the operator is alerted when a mistake is about to be made, or the poka-yoke device prevents the mistake from being made. In Shingo’s lexicon, the former implementation would be called a warning poka-yoke, while the latter would be referred to as a control poka-yoke.

Shingo argued that errors are inevitable in any manufacturing process, but that if appropriate poka-yokes are implemented, then mistakes can be caught quickly and prevented from resulting in defects. By eliminating defects at the source, the cost of mistakes within a company is reduced.

A methodic approach to build up poka-yoke countermeasures has been proposed by the Applied Problem Solving (APS) methodology, which consists of a three-step analysis of the risks to be managed:

1. Identification of the need

2. Identification of possible mistakes

3. Management of mistakes before satisfying the need

This approach can be used to emphasize the technical aspect of finding effective solutions during brainstorming sessions.

3 Rules of Poka Yoke

1. Do not wait for the perfect POKA YOKE. Do it now!

2. If your Poka-Yoke idea has better than 50% chance to succeed…Do it!

3. Do it now…. improve later!

Benefits Of poka-yoke Implementation

A typical feature of poka-yoke solutions is that they don’t let an error in a process happen. Other advantages include:

1. Less time spent on training workers.

2. Elimination of many operations related to quality control;

3. Unburdening of operators from repetitive operations.

4. Promotion of the work improvement-oriented approach and actions.

5. A reduced number of rejects.

6. Immediate action when a problem occurs.

7. 100% built-in quality control.

8. Preventing bad products from reaching customers.

9. Detecting mistakes as they occur.

10. Eliminating defects before they occur.

References:

1. Robinson, Harry (1997). “Using Poka-Yoke Techniques for Early Defect Detection”. Berry College. Archived from the original on December 27, 2014. Retrieved May 4, 2009.

2. ^ Jump up to:a b c Shingo, Shigeo; Dillon, Andrew (1989). A study of the Toyota production system from an industrial engineering viewpoint. Portland, OR: Productivity Press. ISBN 0-915299-17-8OCLC 19740349.

3. ^ John R. Grout, Brian T. Downs. “A Brief Tutorial on Mistake-proofing, Poka-Yoke, and ZQC”. John Grout’s Mistake-Proofing Center. Archived from the original on Apr 14, 2009. Retrieved May 4, 2009.

4. ^ “The Sayings of Shigeo Shingo: Key Strategies for Plant Improvement”. QualityCoach.Net. ISBN 9781563273841. Archived from the original on January 28, 2014. Retrieved August 20, 2012.

5. ^ Jump up to:a b “Poka Yoke or Mistake Proofing :: Overview”. The Quality Portal. Retrieved May 5, 2009.

6. ^ Jump up to:a b Nikan (1988). Poka-yoke: improving product quality by preventing defects. Productivity Press. p. 111ISBN 978-0-915299-31-7.

7. ^ Ivan Fantin (2014). Applied Problem Solving. Method, Applications, Root Causes, Countermeasures, Poka-Yoke and A3. How to make things happen to solve problems. Milan, Italy: Createspace, an Amazon company. ISBN 978-1499122282

8. ^ Misiurek, Bartosz (2016). Standardized Work with TWI: Eliminating Human Errors in Production and Service Processes. New York: Productivity Press. ISBN 9781498737548.

Inventory

Inventory exists in supply chain because of mismatch between demand and supply, some consider it as evil some consider it as essential. Few sector its intentional such as steel manufacturer, where it is economical to manufacture in large lots for future sales, Retail store is another such example where inventory is held in anticipation of future demand.

Another significant role that inventory plays is to reduce cost by exploiting economies of scale that may exist during production and distribution.

Inventory impacts the assets held, the costs incurred, and responsiveness provided in the supply chain. High levels of inventory in an apparel supply chain improve responsiveness but also leave the supply chain vulnerable to the need for markdowns, lowering profit margins. Low levels of inventory improve inventory turns but may result in lost sales if customers are unable to find products, they are ready to buy.

Inventory also has a significant impact on the material flow time in a supply chain. Material flow time is the time that elapses between the points at which material enters the supply chain to the point at which it exits. For a supply chain, throughput is the rate at which sales occur. If inventory is represented by I, flow time by T, and throughput by D, the three can be related using little’s law as follows:

I = DT

For example, if the flow time of an auto assembly process is 10 hours and the throughput is 60 units an hour, Little’s law tells us that the inventory is 60 x 10 = 600 units. If we were able to reduce inventory to 300 units while holding throughput constant, we would reduce our flow time to 5 hours (300/60). We note that in this relationship, inventory and throughput must have consistent units.

The logical conclusion here is that inventory and flow time are synonymous in a supply chain because throughput is often determined by customer demand.

Role in the Competitive Strategy:-

The form, location, and quantity of inventory allow a supply chain to range from being very low cost to very responsive. Large amounts of finished goods inventory close to customers allow a supply chain to be responsive but at a high cost. Centralized inventory in raw material form allows a supply chain to lower cost but at the expense of responsiveness. The goal of good supply chain design is to find the right form, location, and quantity of inventory that provides the right level of responsiveness at the lowest possible cost.

Components of Inventory Decisions:-


CYCLE INVENTORY

Cycle inventory is the average amount of inventory used to satisfy demand between receipts of supplier shipments. The size of the cycle inventory is a result of the production, transportation, or purchase of material in large lots. Companies produce or purchase in large lots to exploit economies of scale in the production, transportation, or purchasing process. With the increase in lot size, however, comes an increase in carrying costs. As an example of a cycle stock decision, consider an online book retailer. This retailer’s sales average around 10 truckloads of books a month. The cycle inventory decisions the retailer must make are how much to order for replenishment and how often to place these orders. The e-retailer could order 10 truckloads once each month or it could order one truckload every three days. The basic trade-off supply chain managers face is the cost of holding larger lots of inventory (when cycle inventory is high) versus the cost of ordering product frequently (when cycle inventory is low).

SAFETY INVENTORY

Safety inventory is inventory held in case demand exceeds expectation; it is held to counter uncertainty. If the world were perfectly predictable, only cycle inventory would be needed. Because demand is uncertain and may exceed expectations, however, companies hold safety inventory to satisfy an unexpectedly high demand.

SEASONAL INVENTORY

Seasonal inventory is built up to counter predictable seasonal variability in demand. Companies using seasonal inventory build up inventory in periods of low demand and store it for periods of high demand when they will not have the capacity to produce all that is demanded. Managers face key decisions in determining whether to build seasonal inventory, and if they do build it, in deciding how much to build. If a company can rapidly change the rate of its production system at very low cost, then it may not need seasonal inventory, because the production system can adjust to a period of high demand without incurring large costs. However, if changing the rate of production is expensive (e.g., when workers must be hired or fired), then a company would be wise to establish a smooth production rate and build up its inventory during periods of low demand. Therefore, the basic trade-off supply chain managers face in determining how much seasonal inventory to build is the cost of carrying the additional seasonal inventory versus the cost of having a more flexible production rate.

LEVEL OF PRODUCT AVAILABILITY:-

Level of product availability is the fraction of demand that is served on time from product held in inventory. A high level of product availability provides a high level of responsiveness but increases cost because much inventory is held but rarely used. In contrast, a low level of product availability lowers inventory holding cost but results in a higher fraction of customers who are not served on time. The basic trade-off when determining the level of product availability is between the cost of inventory to increase product availability and the loss from not serving customers on time.

INVENTORY-RELATED METRICS:-

Inventory-related decisions affect the cost of goods sold, the cash-to-cash cycle, and the assets held by the supply chain and its responsiveness to customers. A manager should track the following inventory-related metrics that influence supply chain performance:

Cash-to-cash cycle time is a high-level metric that includes inventories, accounts payable, and receivables.

Average inventory measures the average amount of inventory carried. Average inventory should be measured in units, days of demand, and financial value.

Inventory turns measure the number of times inventory turns over in a year. It is the ratio of average inventory to either the cost of goods sold or sales.

Products with more than a specified number of days of inventory identifies the products for which the firm is carrying a high level of inventory. This metric can be used to identify products that are in oversupply or to identify reasons that justify the high inventory, such as price discounts or being a very slow mover.

Average replenishment batch size measures the average amount in each replenishment order. The batch size should be measured by SKU in terms of both units and days of demand. It can be estimated by averaging over time the difference between the maximum and the minimum inventory (measured in each replenishment cycle) on hand.

Average safety inventory measures the average amount of inventory on hand when a replenishment order arrives. Average safety inventory should be measured by SKU in both units and days of demand. It can be estimated by averaging over time the minimum inventory on hand in each replenishment cycle.

Seasonal inventory measures the difference between the inflow of product (beyond cycle and safety inventory) and its sales that is purchased solely to deal with anticipated spikes in demand.

Fill rate (order/case) measures the fraction of orders/demand that were met on time from inventory. Fill rate should not be averaged over time but over a specified number of units of demand (say, every thousand, million, etc.).

Fraction of time out of stock measures the fraction of time that a particular SKU had zero inventory. This fraction can be used to estimate the lost sales during the stock out period.

Obsolete inventory measures the fraction of inventory older than a specified obsolescence date

Bibliography:

Supply chain management :  strategy, planning, and operation  /  Sunil Chopra, Peter Meindl

Benefits of Lean Manufacturing for Small-Scale Industries

Lean manufacturing is a methodology that has long been mainly adapted by large industrial operations. However, we can also implement lean manufacturing in small-scale industries, and it can bring significant benefits/change to these organizations.

In this article, we will explore some of the hidden values of lean manufacturing that can help small-scale industries.

Improved Quality: One of the key benefits of lean manufacturing is the focus on eliminating defects and reducing variability in the manufacturing process. By implementing techniques such as 5S and Total Quality Management (TQM), small-scale industries can improve the quality of their products and reduce the number of defects that need to be reworked again and again. This can result in reducing our operational costs and increase customer satisfaction.

Increased Efficiency: Lean manufacturing methods, such as Just-in-Time (JIT) and Kanban, can help to improve the flow of materials and improve information flow throughout the manufacturing process in the industry. By reducing the amount of time and resources required to move materials and products, small-scale industries can increase their efficiency and productivity. This can lead to faster delivery times and higher throughput.

Reduced Costs: By eliminating waste and improving efficiency, lean manufacturing can help small-scale industries to reduce their costs and improve their bottom line. For example, by reducing inventory, small-scale industries can lower their holding costs and reduce the amount of capital tied up in inventory. By improving the flow of materials, small-scale industries can also reduce the need for extra space and resources to store excess inventory.

Increased Flexibility: Lean manufacturing techniques, such as cellular manufacturing and multi-skilled workforce, can help small-scale industries to respond quickly to changes in demand and adapt to new products and markets. By having a flexible workforce and manufacturing process, small-scale industries can quickly adjust to changes in customer demand, without having to invest in new equipment or hire additional staff.

Improved Employee Engagement: Lean manufacturing can also lead to a more engaged workforce as employees are allowed to identify and solve problems, and to make suggestions for improvements. By involving employees in the improvement process, small-scale industries can tap into their knowledge and experience to make the manufacturing process more efficient and effective.

Better Customer Service: Lean manufacturing can also lead to better customer service, as small-scale industries can deliver products faster, with higher quality, and at lower costs. By implementing lean manufacturing, small-scale industries can become more competitive and better able to meet the needs of their customers.

In conclusion, lean manufacturing is often associated with large, industrial operations, but it can be applied to smaller businesses as well. The implementation of lean manufacturing techniques can benefit small-scale industries in terms of improved quality, efficiency, and competitiveness, as well as cost reduction and increased flexibility. Lean manufacturing can be beneficial for small businesses if they recognize its hidden advantages.

References :-

1. 13 Ways to Apply Lean Principles to a Small Business  (13 ways to apply lean principles to a small business (velaction.com))

2. Implementation of lean manufacturing in small scale industry by Raj Kumar Mohnani and Dr. Devendra S. Verma (implementation of lean manufacturing in small scale industry (jetir.org))

3. Article on Lean implementation in small and medium-sized enterprises by Saumyaranjan Sahoo ((PDF) Lean implementation in small and medium-sized enterprises: An empirical study of Indian Manufacturing firms (researchgate.net))

4. What is lean manufacturing? Learn about the principles, UNILOGO, https://unilogo.com.pl/en/blog/what-is-lean-manufacturing-learn-about-the-principles/


5S Methodology

What is 5S?

5S Methodology is a Lean manufacturing technique that is used to create an organized, safe and productive work environment. It is a system that encourages proper organization and cleanliness in the workplace, which can lead to increased efficiency and productivity.


The 5S methodology is based on five simple steps:

  • 1. Sort
  • 2. Set in Order
  • 3. Shine
  • 4. Standardize
  • 5. Sustain.

Origin of 5S: –

5S was developed in Japan and was identified as one of the techniques that enabled Just in Time manufacturing. Two major frameworks for understanding and applying 5S to business environments have arisen, one proposed by Takashi Osada, the other by Hiroyuki Hirano.

Hirano provided a structure to improve programs with a series of identifiable steps, each building on its predecessor. Before this Japanese management framework, a similar “scientific management” was proposed by Alexey Gastev and the USSR Central Institute of Labor (CIT) in Moscow.

The Steps of 5S: –

5S was created in Japan, and the original “S” terms were in Japanese, so English translations for each of the five steps may vary. The basic ideas and the connections between them are easy to understand, though.

Sort: –

The first step of the 5S methodology is sorting through the workplace and getting rid of any unnecessary items. This can include anything from physical clutter to inefficient processes.

Clear the Work Area, examine the equipment, supplies, and things in a work space closely for this stage. Items that are required or helpful for the task being done in that area should be kept there. Remove everything else.

Some of those eliminated objects will need to be recycled or thrown away. Other items should be returned to their “homes,” which could be another work procedure or location. You may discover certain things, nevertheless, about which you are unsure.

Use a red tag if you come across something that you are unsure of the ownership of or that you are unable to identify. The process of “Red-Tagging” briefly affixes a tag with location and time information on the item. Then, all red-tagged tools, supplies, and equipment from all work areas are gathered in one spot to serve as a “lost and found” for those items.

Check the red tag collection area to see whether an important tool that is missing from a work area has been located elsewhere. Every so often, the supervisors of each work area should check the red tag collection area to see whether anything was forgotten. Take everything that belongs in a workspace back there.

Reassigning Tagged Items

The red tag collection area may have items waiting for a very long period. In that instance, it appears that the original work area (where that item originated) no longer need it. However, it might be valuable somewhere else. Items may be kept in the red tag collection area for thirty days in one usual method. Any supervisor may then claim the item for their own work area following that. After another week, if no one has expressed interest, the item may be completely removed from the facility. You can either sell, recycle, or discard it.

It could be wiser to put something away for later use if the organization will absolutely need it but not now. Make sure you will genuinely need something in the future before storing it. Make a concrete strategy for removing that item from storage at a certain period in the future. Without a valid reason, avoid keeping anything “just in case,” and keep a record of what has been kept.

Set in Order: –

The second step is to organize the workplace. This means creating an organized layout of the workplace and tools, as well as developing systems and processes that can be easily understood and followed.

Building a 5S Map

Tools that are regularly used should be kept close to where they are utilized. Spare supplies, tools, and other resources that aren’t frequently used can be maintained in one place and shared by several teams. Items that are frequently used together, such drills and drill bits, should be kept next to one another in storage. Even though each of these choices will be reasonable on its own, it could be challenging to keep track of everything. Making a 5S map as part of this procedure can be useful.

A diagram or floor plan known as a 5S map gives a general picture of a work area, procedure, or station. It gives a graphic representation of the locations and connections between the workers, suppliers, tools, and travel routes. A good map may also provide a description of the activities taking on in the area highlighted.

Depending on your facility’s needs, you may find one approach easier than another:

  • 1. Draw up a map, and then implement it
  • 2. Physically arrange the workplace first, and then map it out
  • 3. Map as you go, testing ideas and writing down what works well

No matter which approach is used to create it, the resulting 5S map should be kept as a training tool, used for reference in later steps of 5S, and updated over time as the work area changes.

Communicating the Plan

Each storage facility has to be labelled after storage sites are assigned. To make it easier for employees to instantly recognize what is within each cabinet, label the outside of the doors. Then, identify any inside shelves to indicate the proper placement of various goods. Bins, rack labels, and other storage systems can all use the same concepts.

To make sure that each instrument is simple to return to its proper storage location, several facilities employ a “shadow board” for tool storage. With this method, a label that matches the tool’s size and form is placed where it belongs. Workers can quickly identify where each item belongs and determine if it is present or not by scanning the area. No more wasting time digging through cabinets and containers.

Organization can extend to the floor, too. Work areas, movement lanes, and storage for supplies and finished products can all be marked with floor marking tape.

Shine: –

The third step is to clean the workplace. This means removing dirt, dust and debris, and ensuring that all areas of the workplace are clean and safe.

Shine moves far beyond just pushing a broom around every now and then. It involves regular cleaning of every part of the work area — often a daily wipe-down, and a more thorough cleaning each week.

Importantly, the Shine step is not meant to be a job for the maintenance or janitorial staff. Each worker should clean their own work area, and the equipment they use. This approach has several benefits:

  • 1. Workers who are familiar with the area will quickly notice any problems that arise
  • 2. Hazards or difficult situations will be understood and accounted for
  • 3. Items that are out of place or missing will be recognized
  • 4. Workers will tend to keep their own workspaces cleaner during normal operations

Everyone should pay attention to the overall cleanliness of the workplace, being willing to pick up trash and so on. But for 5S to give the best results, each worker should take personal responsibility for their own working space.

Shine as Preventative Maintenance

It will be beneficial in many ways to keep work areas tidy. One significant benefit is that leaks, cracks, or misalignments are simple to detect. If the individuals responsible for maintaining the area’s cleanliness are also those who often work there, they will be able to spot any issues right away.

If those issues go undiscovered and unfixed, it could lead to equipment failure, safety risks, and decreased production. The system can contribute to a preventative maintenance program with the ongoing cleaning and inspections employed in the Shine step of 5S. By doing so, 5S can increase the lifespan of machinery and lessen the need for emergency downtime.

Standardize: –

The fourth step is to standardize the workplace. This means creating and enforcing processes and procedures that are consistent throughout the entire workplace.

The Power of Writing Things Down

According to a proverb, “If it’s not in writing, it didn’t happen.” Making ensuring that the decisions you make for your 5S program are documented can help to ensure that your work doesn’t simply vanish. The 5S map you created in the Set in Order stage can be incorporated into your new standard for the region. The method you employ for red-tagging items can be documented and incorporated in the standards in a similar manner.

Even if you put your decisions in writing, you can still change your mind. The goal of 5S is to improve your workplace, not to immobilize it. Standards for your facility are created by you, and you are free to modify them to meet evolving business requirements or new facts.

Tools for Standardizing

Once you’ve made decisions on how to change your work practices, those decisions need to be communicated to workers. This communication is a key part of the Standardize step. Common tools for this process include:

  • 5S checklists – Listing the individual steps of a process makes it easy for workers to follow that process completely. It also provides a simple auditing tool to check progress later on.
  • Job cycle charts – Identify each task to be performed in a work area, and decide on a schedule or frequency for each of those tasks. Then, assign responsibility to a particular worker (or job duty). The resulting chart can be posted visibly to resolve questions and promote accountability.
  • Procedure labels and signs – Provide operating instructions, cleaning steps, and preventative maintenance procedures right where that information will be needed.

Sustain: –

The fifth and final step is to sustain the improvements made by the previous four steps. This means regularly maintaining the workplace and ensuring that any changes made
Never “Once and Done”

The 5S method was designed to be a continuing cycle rather than a one-time event. This is crucial since early 5S triumphs might pave the way for issues. The end outcome could be an even worse mess if open space is created during the Sort step and then allowed to progressively fill it with tools and materials without any structure. The answer is to continuously implement the 5S principles as a routine component of everyday work. Because of this, sustain is crucial.

Sustaining a 5S program can mean different things in different workplaces, but there are some elements that are common in successful programs.

  • Management Support – Without visible commitment from managers, the 5S processes won’t stick around. Supervisors and managers should be involved in auditing the 5S work processes, and getting feedback from workers. They also need to provide the tools, training, and time for workers to get their jobs done right.
  • Department Tours – Bringing teams from one department to visit other departments will help familiarize the entire workforce with the processes of your facility. This type of “cross pollination” helps to spread good ideas, and inspires people to come up with new ways to improve the 5S implementation.
  • Updated Training – As time passes, there may be changes in your workplace, such as new equipment, new products, or new work rules. When this happens, revise your 5S work standards to accommodate those changes, and provide training on the new standards.
  • Progress Audits – The standards that are created in the 5S program should provide specific and measurable goals. Checking on those goals with a periodic audit can provide important information and guidance. Where is 5S working well? Where are teams falling behind?
  • Performance Evaluations – Once you know your goals are reasonable, make performance part of each employee evaluation. When teams and individuals perform well, celebrate it, and post overall results so each team can see how they compare to the rest of the facility.

Sustain is Not the End of 5S

While it’s the last step in the sequence, sustain is not the end of 5S as a whole. One pass through the steps can expose problems that were hidden beforehand. Following the steps again can resolve those problems, and help discover new ways to improve. Continue through the cycle again and again to keep your facility at the top of its potential.

A Sixth “S” for Safety: –

The 5S method is one of the most well-known and frequently utilized lean tools when it comes to lean manufacturing and workplace improvement. It should come as no surprise that 5S can boost productivity at work, save expenses, and raise standards. But with many lean projects, it’s simple to narrow your attention to only those objectives and ignore the human element. Safety for employees is crucial. Because of this, many facilities extend the 5S cycle by one more step, resulting in “6S” — with Safety.

Safety is not a step that comes after the first five. Each of the subsequent processes must take it into account. For instance, during the Sort phase, you can conclude that a specific tool is no longer useful because a more recent version is safer to use. To improve workplace safety as well as efficiency, work routines must be standardized during the Standardize step.

Benefits of a 5S Program: –

Because 5S focuses on improving a workplace, and different workplaces may have little in common, it can be hard to predict the exact results of using the program. However, some benefits are almost always found:

  • Better Time Usage – Getting rid of unwanted materials and organizing the important tools and supplies will eliminate clutter and confusion. Workers spend less time finding and retrieving what they need, and can be more productive instead.
  • Less Wasted Space – Eliminating unnecessary material stockpiles and consolidating tool storage will clear up room for more useful applications. Every square foot of floor space has a cost, and getting the most out of that investment will maximize your facility’s profitability.
  • Reduced Injury Rates – Organizing work areas for efficiency and ease of use will reduce the movements needed for workers to do their jobs. Removing clutter and routinely cleaning up spills will eliminate trip hazards. As a result, workers will experience less fatigue and fewer injuries.
  • Reduced Equipment Downtime – When tools and equipment are kept clean, routinely inspected, and used in a standardized way, preventative maintenance is much easier, and major failures can often be prevented entirely.
  • Improved Consistency and Quality – Standardizing work processes will reduce variations and mistakes. By eliminating faults and failures, overall productivity can be dramatically improved.
  • Heightened Employee Morale – When 5S principles are used effectively, workers see that their input is valued, and their performance is recognized. This creates an environment where workers can feel pride in their work, and take an interest in improving their company.

Applications: –

The 5S concept has evolved from manufacturing and is currently used in a wide range of sectors, including government, education, and health care. In the healthcare industry, visual management and 5S can be especially helpful because a hasty search for supplies to treat a distressed patient (a persistent issue in the industry) can have disastrous results. Despite having its roots in manufacturing, the 5S technique can also be used in knowledge economy jobs where information, software, or media replace physical products.

References: –

[1] Michalska, J. and Szewieczek, D., 2007. The 5S methodology as a tool for improving the organization. Journal of achievements in materials and manufacturing engineering, 24(2), pp.211-214.
[2] Agrahari, R.S., Dangle, P.A. and Chandratre, K.V., 2015. Implementation of 5S methodology in the small-scale industry: a case study. International Journal of Scientific & Technology Research, 4(4), pp.180-187.
[3] https://www.projectcubicle.com
[4] https://www.graphicproducts.com/articles/what-is-5s/


14 Lean Management Principles

A lean organization achieves its goals through the application of time-tested techniques and tools, backed by a firm philosophical foundation of continuous improvement and learning. Behind the lean paradigm are a set of management principles that when consistently applied, result in business success regardless of one’s industry.

What is Lean Management?

Traditionally, we expect management to be the function that is involved in the planning, organizing, directing and controlling resources to achieve organizational goals. In lean thinking, management is the systematic approach of enabling the organization to make its lean initiatives in a focused and efficient manner.

Most organizations fail to sustain their lean efforts due to lack of proper direction from management. The traditional approach of “control” does not work in a lean environment because it does not lend itself to the philosophy of empowering workers to find solutions to the business problems through observation, experimentation, and learning.

The old way of doing things sees managers as people who should provide all the answers to workers on the ground. In lean thinking, however, everybody works together with a clear focus on customer value and continuous improvement.

Lean Thinking Management Principles

The following 14 lean management principles which originated from Toyota provide the philosophical foundation required to achieve success in a lean system. Each has a set of tools that can be used to attain the organizational goals.

These tools are meant to assist a company in achieving results and should not replace a common sense approach to problem-solving. The application of lean tools must happen with the underlying principle in mind. In short, the theory drives the tool and not the other way round.

1. Long-term thinking

The most important factors for success are patience, a focus on long-term rather than short-term results, reinvestment in people, product, and plant, and an unforgiving commitment to quality.

—Robert B. McCurry, former Executive VP, Toyota Motor Sales

Lean thinking organizations have a clear vision of where they want to be in the future. They have a clear picture of what needs to be done to achieve these goals and do not get distracted by the expediencies of the moment. The first principle of lean management is: “Make decisions based on your long-term vision even if means making sacrifices in the short-term.”

The lean tools that drive this principle are:

Hoshin Kanri is a strategic planning tool that ensures the whole organization is aligned to a common goal and leaves little room for diversion. Everybody knows where the company’s direction and their responsibilities in achieving these goals.

Nemawashi is a consensus-based decision-making approach that reduces the time taken to achieve results. By the time a formal meeting is held to make a decision, all involved parties have been consulted and have made up their minds on where they stand on an issue.

2. Flow the Customer Value

This principle deals with identifying wasteful activities that do not add any value to the customer. After determining the wasteful activities, have efforts are made to either eliminate or reduce them. You then align all the other steps in a continuous flow which increases productivity, quality, safety, and morale. There is also a marked reduction in costs as it requires fewer resources for achieving the same results.

If some problem occurs in one-piece flow manufacturing then the whole production line stops. In this sense it is a very bad system of manufacturing. But when production stops everyone is forced to solve the problem immediately. So team members have to think, and through thinking team members grow and become better team members and people.

—Teruyuki Minoura, former President, Toyota Motor Manufacturing, North America

The lean thinking tools that support this principle are:

Jidoka means building in quality into machines or process to prevent mistakes that have an impact on quality. This tool aims at capturing and correcting errors before they affect the next operation.

Line balancing is used to ensure that equal amount of work passes through the process to avoid the bottlenecks that hinder smooth flow of value

Cellular manufacturing increases flow by consolidating all the prerequisite steps that are required to assemble a product in one place. It also reduces the amount of time used when sub-assemblies move from one station to another   

3. Produce at the rate of customer demand

The more inventory a company has, the less likely they will have what they need” – Taiichi Ohno (Father of the Toyota Production System)

Overproduction means “producing faster or more than the customer is demanding.” It is one of the most costly forms of waste as it encompasses all the known wasteful activities in lean manufacturing. By producing at a rate as close as possible to the real customer demand, costs reduce as there is very little unsalable inventory in place.

The tools that support this principle are:

Kanban system is a signalling device that informs a process what to do next whether it is producing a new product or replenishing raw materials.

Takt time is a metric that determines the rate at which the end customer is demanding a product. All the processes must be synchronized with this rate to avoid non-delivery or over-production

4.Level the workload

In general, when you try to apply the TPS, the first thing you have to do is to even out or level the production. And that is the responsibility primarily of production control or production management people. Levelling the production schedule may require some front-loading of shipments or postponing of shipments and you may have to ask some customers to wait for a short period of time.

—Fujio Cho, President, Toyota Motor Corporation

As companies cannot always produce at the exact frequency of customer demand, production must be evened out across production facilities to ensure prompt delivery. The system works by accumulating a good number of customer orders and then scheduling them at even intervals. Levelling reduces the waste and strain of trying to build to an erratic order. The lean tool used to level the workload is:

Heijunka is the balancing of production to mitigate against the unpredictable spikes in demand that occur in a typical organization. Heijunka stabilizes the production process and ensures the optimal utilization of available resources

Heijunka Box

5.Quality right the first time

Mr. Ohno used to say that no problem discovered when stopping the line should wait longer than tomorrow morning to be fixed. Because when making a car every minute we know we will have the same problem again tomorrow.

—Fujio Cho, President, Toyota Motor Corporation

A fundamental tenet of lean thinking is that all methods must produce quality parts so that the end product to the customer is defect-free. This principle states that no process should produce, accept or pass on a defective part to the next step. Inspection is a wasteful process because resources have already gone into the production of faulty parts. The aim should be to capture defects before they occur.

The Jidoka tool is also applied here as a means of capturing and reporting the occurrence of a defect. Another closely related device is the andon which is also a signal to the process that an error has occurred that needs correcting.

Andon System

6. Standardize and Improve

Standard work sheets and the information contained in them are important elements of the Toyota Production System. For a production person to be able to write a standard work sheet that other workers can understand, he or she must be convinced of its importance…. High production efficiency has been maintained by preventing the recurrence of defective products, operational mistakes, and accidents, and by incorporating workers’ ideas. All of this is possible because of the inconspicuous standard work sheet».

Taiichi Ohno


A standard is the best-known way of doing work. The principle of standardization serves as a reference point for further improvement and also as a means of training new workers on how to complete tasks. Without standards, there can be no way of improving in a lean system.

Improvement on the current way of doing things is a continuous process, and once improvement happens, a new standard must result. Rules are not cast in stone and will change through constant improvement. The tool used to support this lean principle is the Kaizen event.

7. Use visual controls

Mr. Ohno was passionate about TPS. He said you must clean up everything so you can see problems. He would complain if he could not look and see and tell if there is a problem.»

Fujio Cho,
Toyota Motor Corporation, 1999-2005

The purpose of visuals in a lean thinking organization is to communicate in a clear and unambiguous manner to the people working in a process as to the state of that process. Visual control is a lean tool used to bring problems to the surface and afford the workforce an opportunity to solve them.

When problems are hidden, there is no chance of solving them, and this leads to stagnation of the lean initiative. With visual controls, deviations from the acceptable standard are visible and countermeasure to bring the system back online can quickly be taken.

Tools used for visual control include:

5S is a systematic program that helps in orderliness and removal of waste

Process control boards show the status of processes and whether or not they are within specified limits

8. Use the right technology

Society has reached the point where one can push a button and be immediately deluged with technical and managerial information. This is all very convenient, of course, but if one is not careful there is a danger of losing the ability to think. We must remember that in the end it is the individual human being who must solve the problems».

Eiji Toyoda,
Challenge and Courage, Toyota Motor Corporation, 1983

Lean thinking organizations do not install technology just because it is the in-thing at the moment. They seriously consider whether the technology will assist them to achieve the goals or whether it will be an impediment to the attainment of value for the customer.

A good example is ERP & MRP systems. While many organizations will rush to install these complex systems, lean thinking firms will first concentrate on the simple problem solving and waste removal tools they have at their disposal. If technology is deemed to be appropriate and relevant to their current issues, the lean thinking firms will surely go ahead and purchase them.

9. Leaders are grown, not bought

Until senior management gets their egos out of the way and goes to the whole team and leads them all together … senior management will continue to miss out on the brain power and extraordinary capabilities of all their employees. At Toyota, we simply place the highest value on our team members and do the best we can to listen to them and incorporate their ideas into our planning process».

Alex Warren, former Senior VP,
former Senior VP, Toyota Motor Manufacturing, Kentucky

This lean management thinking philosophy calls for the development of competent leaders from within an organization rather than always hiring from outside. When this happens, the continuity of business is guaranteed because there is a constant pool of possible leaders who are ready to take over when the time comes.

This constant mentoring of leaders who thoroughly understand the work and live the philosophy of a company is critical in sustaining lean improvements because of maintaining institutional memory.

10. Personal development of people

Respect for people and constant challenging to do better—are these contradictory? Respect for people means respect for the mind and capability. You do not expect them to waste their time. You respect the capability of the people. Americans think teamwork is about you liking me and I liking you. Mutual respect and trust means I trust and respect that you will do your job so that we are successful as a company. It does not mean we just love each other».

Sam Heltman,
Senior Vice President of Administration Toyota Motor Manufacturing, North America (one of the first five Americans hired by Toyota)

Lean continually challenges team members to do their best to solve common business problems. By empowering the workforce to take charge of solving their problems, lean companies improve their skills which ultimately has a significant impact on the business.

The Job Instruction Method perfected at Toyota is one of the essential tools for improving the skills of the workforce in a lean environment.

11. Treat partners with respect

Toyota is more hands-on and more driven to improving their own systems and then showing how that improves you…”

Toyota is more hands-on and more driven to improving their own systems and then showing how that improves you… Toyota will do things like level their production systems to make it easier on you. Toyota picks up our product 12 times per day. They helped move presses, moved where we get the water from, trained our employees. On the commercial side they are very hands-on also—they come in and measure and work to get cost out of the system. There is more opportunity to make profit at Toyota.

“We started with Toyota when we opened a Canadian plant with one component and, as performance improved, we were rewarded, so now we have almost the entire cockpit. Relative to all lean companies we deal with, Toyota is the best.”

An automotive supplier

Treat suppliers and all other players in the extended enterprise with respect. This principle encourages cooperation and coordination within the extended enterprise which includes suppliers at all tiers. Suppliers and their suppliers are an essential part of the value chain that delivers the needs of the customer.

Lean thinking organizations work with their suppliers and help them to improve for the benefit of all the stakeholders. They understand that their success is dependent on the success of all in a win-win relationship that is defined by mutual respect and cooperation.

12. Gain a first-hand understanding of problems

«Observe the production floor without preconceptions and with a blank mind. Repeat “why” five times to every matter».

Taiichi Ohno,
(as quoted in The Toyota Way document)

This principal focuses on problem-solving that gets to the underlying causes by intimately interrogating the problem at source. The person trying to solve a problem must go to where the problem is occurring and observe the complex interactions of all the parameters before suggesting solutions.

Genchi genbutsu means “go and see” the source of a problem and find out what the exact causes are. It is a lean way of thinking that is not satisfied with second-hand reports but calls for real confirmation at the ground.

13. Build consensus before acting

«If you’ve got a project that is supposed to be fully implemented in a year, it seems to me that the typical American company will spend about three months on planning, then they’ll begin to implement. But they’ll encounter all sorts of problems after implementation, and they’ll spend the rest of the year correcting them. However, given the same year-long project, Toyota will spend nine to 10 months planning, then implement in a small way—such as with pilot production—and be fully implemented at the end of the year, with virtually no remaining problems».

Alex Warren,
former Senior Vice President, Toyota Motor Manufacturing, Kentucky

Because business decisions affect many people, lean thinking organizations use this principle of agreement–building to communicate widely before any implementation. This agreement reduces resistance to lean programs and allows management to focus on the necessary actions required to succeed.

The nemawashi consensus-building approach is the fastest way to gain acceptance of lean initiatives through prior consultations before making final decisions.

14. Become a learning organization

«We view errors as opportunities for learning. Rather than blaming individuals, the organization takes corrective actions and distributes knowledge about each experience broadly. Learning is a continuous company-wide process as superiors motivate and train subordinates; as predecessors do the same for successors; and as team members at all levels share knowledge with one another».

The Toyota Way document 2001,
Toyota Motor Corporation


                   This principle of lean management emphasizes the need for continuous evolution through constant reflection and re-adjustment based on the learning gained in the lean journey. Businesses must not stagnate in the past, but should continuously evolve to meet current and future challenges.


Reference:

https://leanfactories.com/14-lean-management-principles/

The Toyota Way (Book) by Jeffrey K .Liker

Image Source:

https://kanbanize.com/lean-management/hoshin-kanri/what-is-hoshin-kanri

https://www.latestquality.com/andon-in-manufacturing/

https://safetyculture.com/topics/one-piece-flow/

https://www.creativesafetysupply.com/articles/kanban/

Article by: Mohamed Khaleelullah K