
OTIF Improvement Project
What is OTIF?
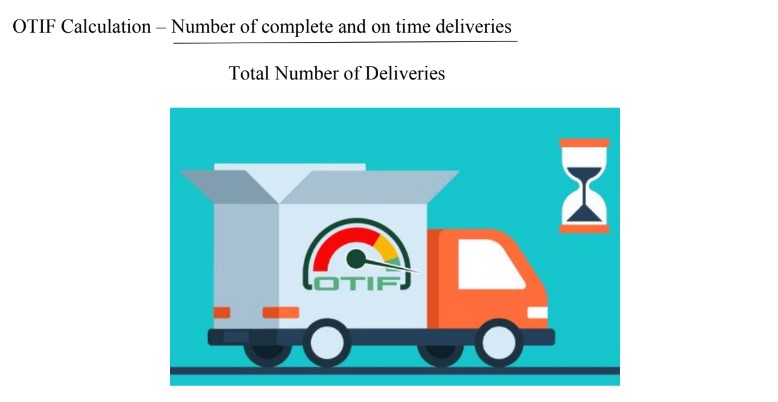
OTIF stands for On Time in Full. OTIF can be defined as delivering the product on time with the right quantity and quality to the customer.
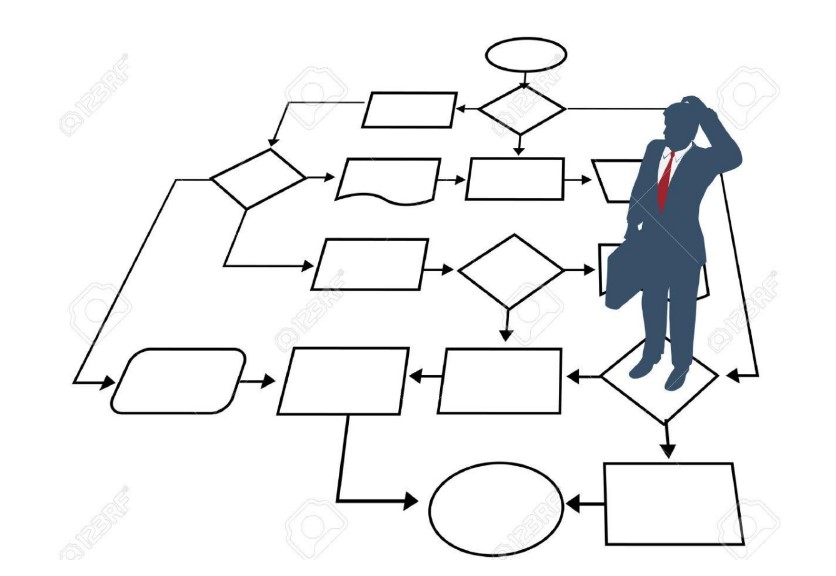
First step for OTIF improvement is to understand the process flow and identify the main delay reasons due to which there is OTIF failure. Using the 80-20 rule the 20% of reasons that caused 80% of the delays were identified.
The main delay reasons identified were:
- Semi-Finished Good (SFG) unavailability
- Lack of visibility of orders on the system
- High lead time between important milestones
SFG Unavailability:
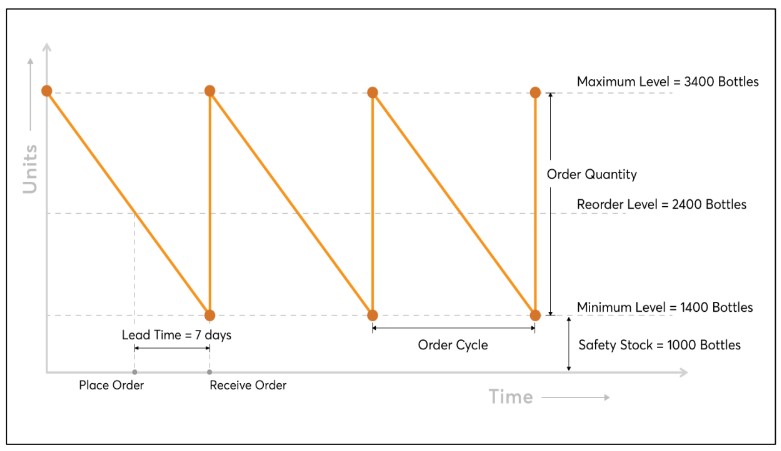
SFG unavailability was mainly due to lack of inventory practices. To address the issue, Minimum and Maximum levels of inventory had to be set for all SFG’s along with a Re-order Level.
- Minimum stock level: Threshold value below which inventory level should not drop.
- Maximum stock level: Maximum quantity of stock that is to be in hand
- Re-order Level: Inventory level at which process order is to be released to replenish the stock
This ensures all SFG follow the Make to Stock (MTS) production strategy and and all orders coming in would be Make to Order (MTO) thus reducing SFG shortages and also the overall lead time of the process.
Approach to define Min-Max & Re-Order Level
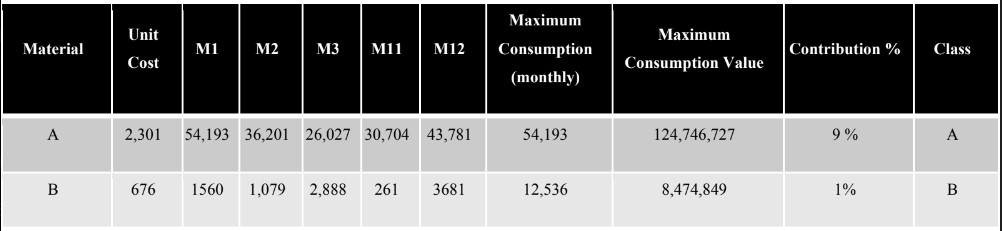
1. Based on monthly consumption pattern of all SFG stock used materials would be classified into A, B and C classes.
A – Runner materials – Most repeated materials
B – Repeater materials – Less often repeated materials
C- Stranger materials – Materials that are used once in a while
Based on Monthly Consumption
2. Maximum & Average Demand During Turn Around Time
− Maximum Demand = Production Lead Time * Maximum Daily Consumption
− Average Demand = Production Lead Time * Average Daily Consumption
3. Defining ROL, Min & Max Inventory Levels
− Re-Order Level = Maximum Demand during Turn Around Time
− Minimum stock level = Reorder point – Average demand during Turn Around Time
− Maximum stock level = Reorder point + Maximum demand during Turn Around Time
Process of setting Inventory Levels for a material
- The raw consumption data for all varieties of the material was taken along with the previous processing materials.
- The varieties were drilled down to only one variety as it was the only that was stored as SFG. There were 25 types of SFG for that variety.
- After segregation of the list of materials based on the varieties, then discussed with the team for further understanding of items given to identify actual consumption of the material.
- During discussion it was identified that 25 SFG’s segregated consisted of materials that were part of the intermediate process to prepare the final SFG
- On further discussion with the production manager the list was drilled down and a final list of SFG’s with 10 products was prepared and signed off by the manager.
- The actual production data of the plant for Last year (Apr’21 to Mar’22) was collected to identify the actual output of the plant and compared it with last year’s consumption to avoid capacity mismatches.
- Using this data SFG levels for the material were calculated using the above-mentioned formulas.
These inventory levels and reorder levels are now set in the system. When the inventory levels of the material reaches reorder level, system will automatically initiate production plan for that item.
Lack of visibility of orders in the system and High Lead time between important milestones
A basic process flow was created from Order entry to product dispatch to the customer. The lead time for all orders vary based on the customer and/or country required certificates and documents and mode of shipment. This causes different streamlines for each order and the lead time variance is high. To further understand these streamlines Country-wise and customer-wise certifications and documents data was collected. This data was used to identify the most common streamline of orders.
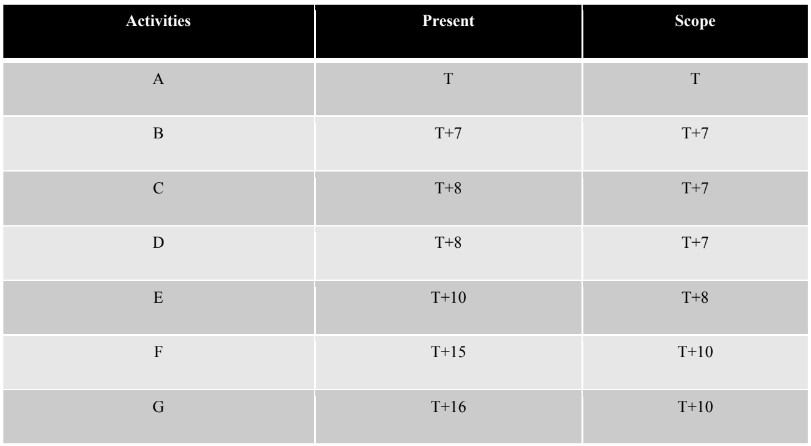
10 Case studies on different sales orders was used to study the entire process flow from Order creation to product dispatch. The process flow compared the standard lead time of each process with the actual lead time data that was gathered from the case studies. The average lead time between the date product was ready and order dispatched to customer was 30 days.
Hence, to reduce the overall lead time parallelizing and sequencing of the activities in the streamline was done. A time and action plan was designed for the same and pre-requisites for certificates and documents and for material movement was mapped.
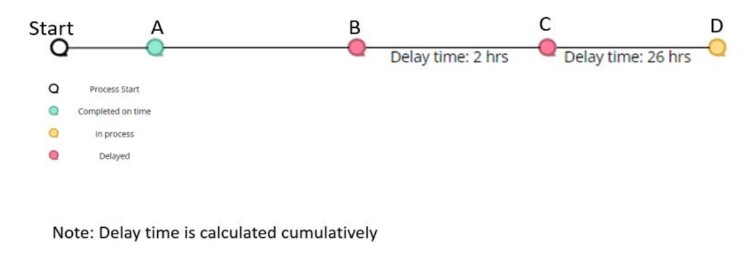
To provide further visibility on orders through the system a dashboard will be available to allow the user to check the status of each order along the process flow. This dashboard will also help identify delays in the process and display the total hours of delays.
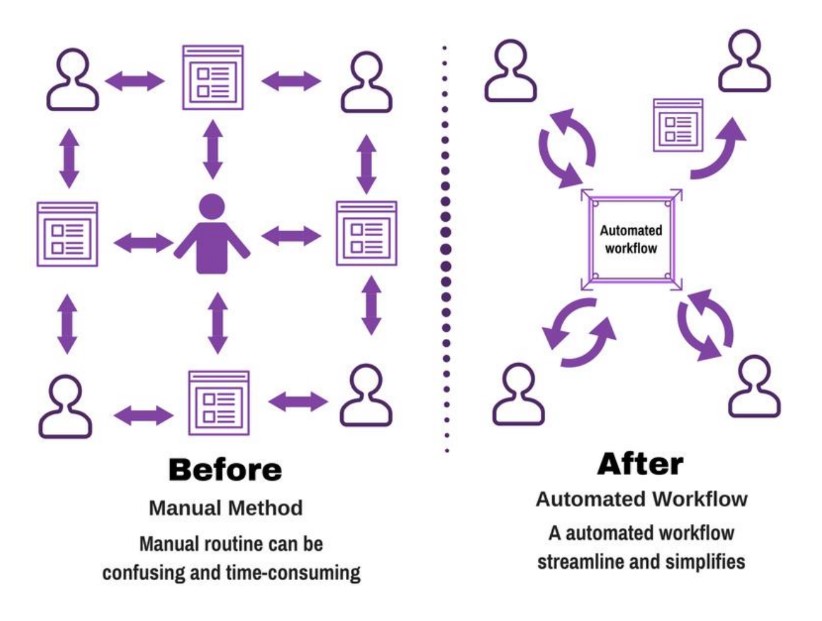
Automating the workflow management through the system will help avoid miscommunication and communication delays. This will also reduce man dependency and allows easy progress monitoring.
Article By:- Rju Samrat