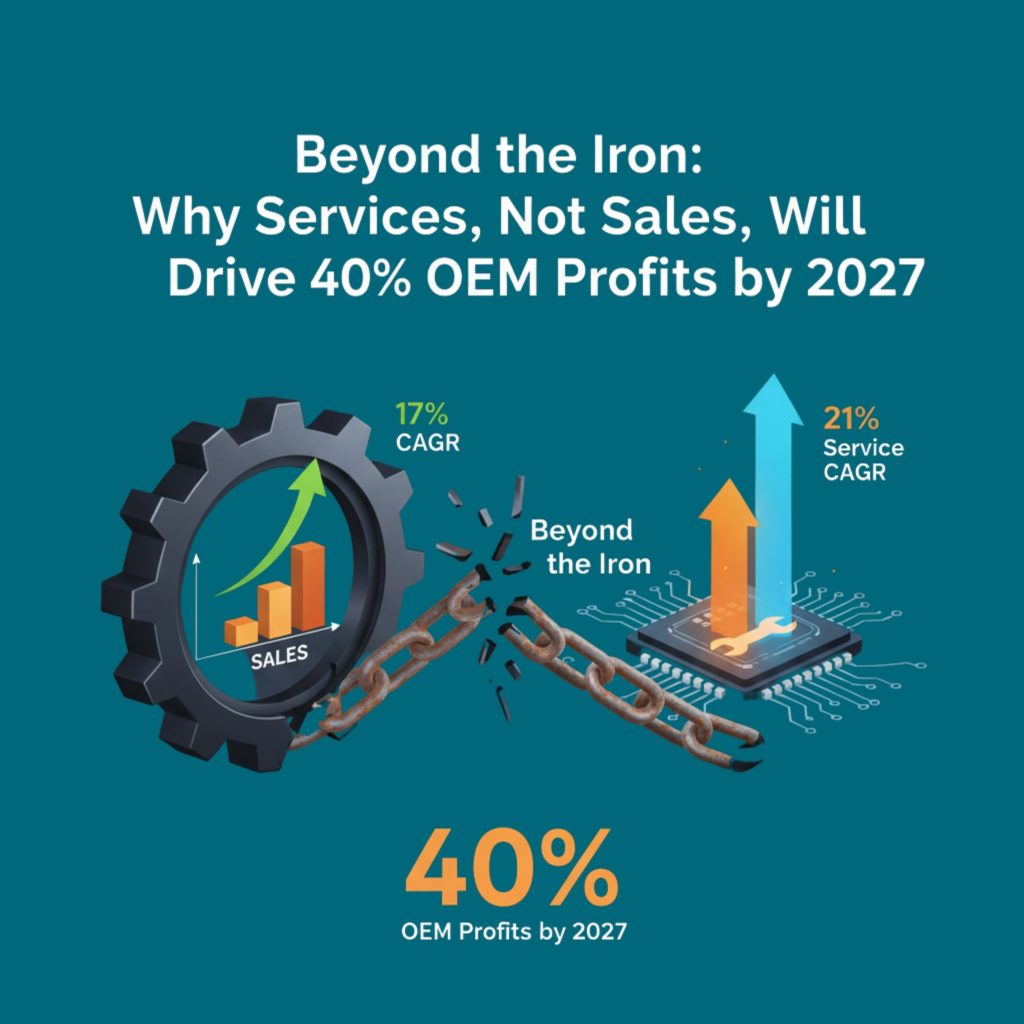
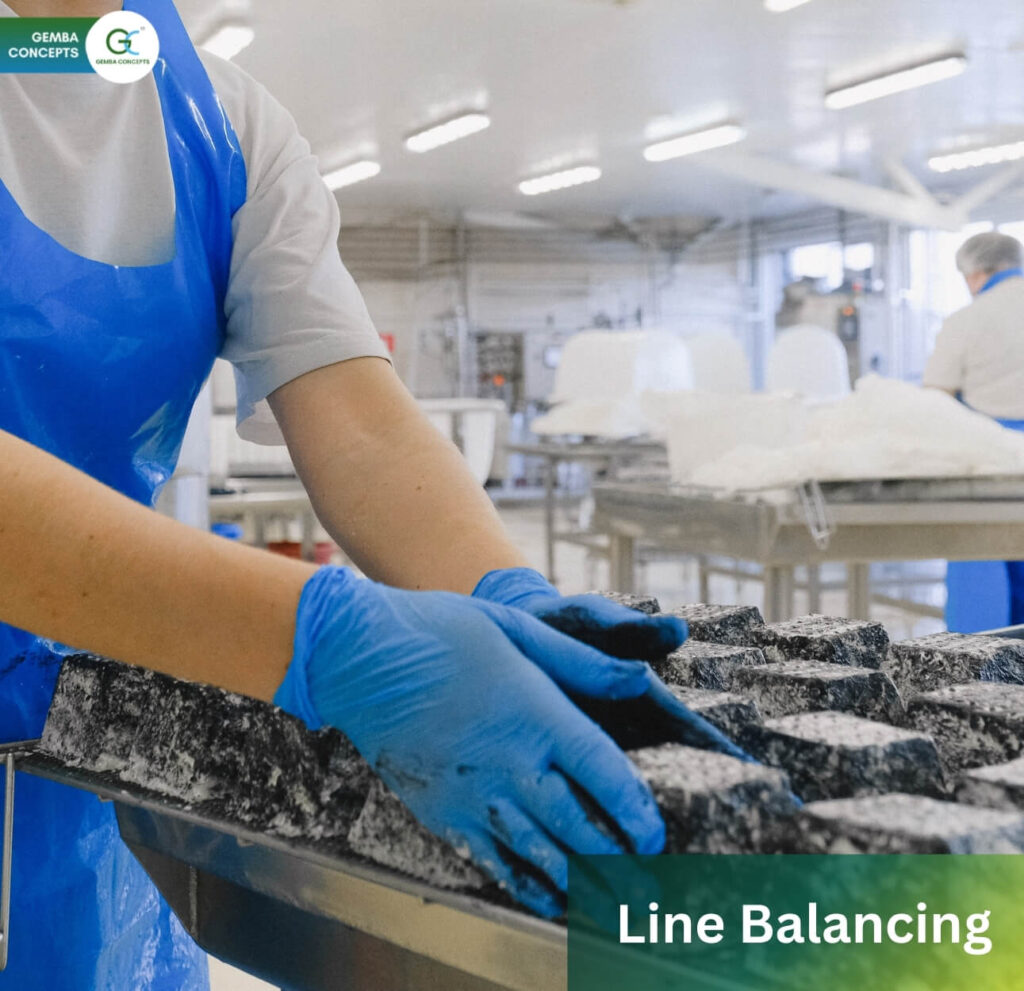
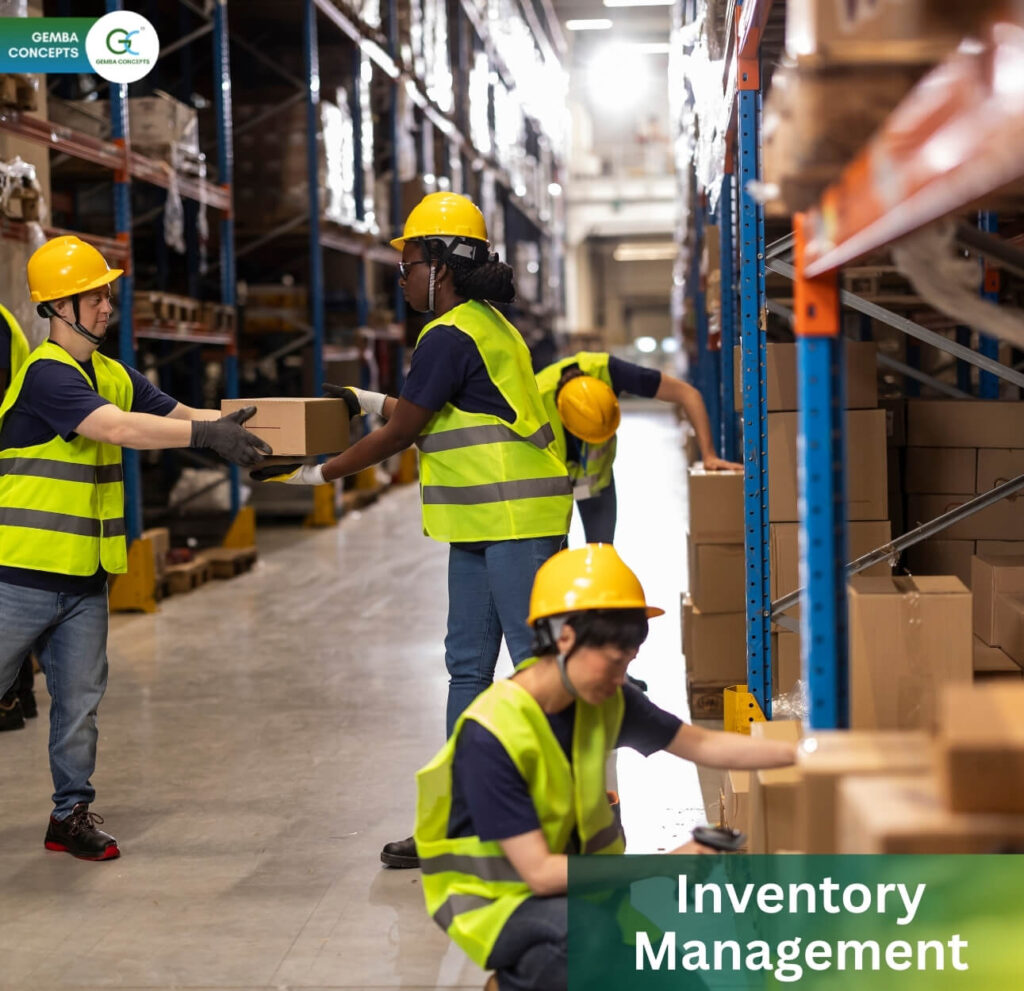
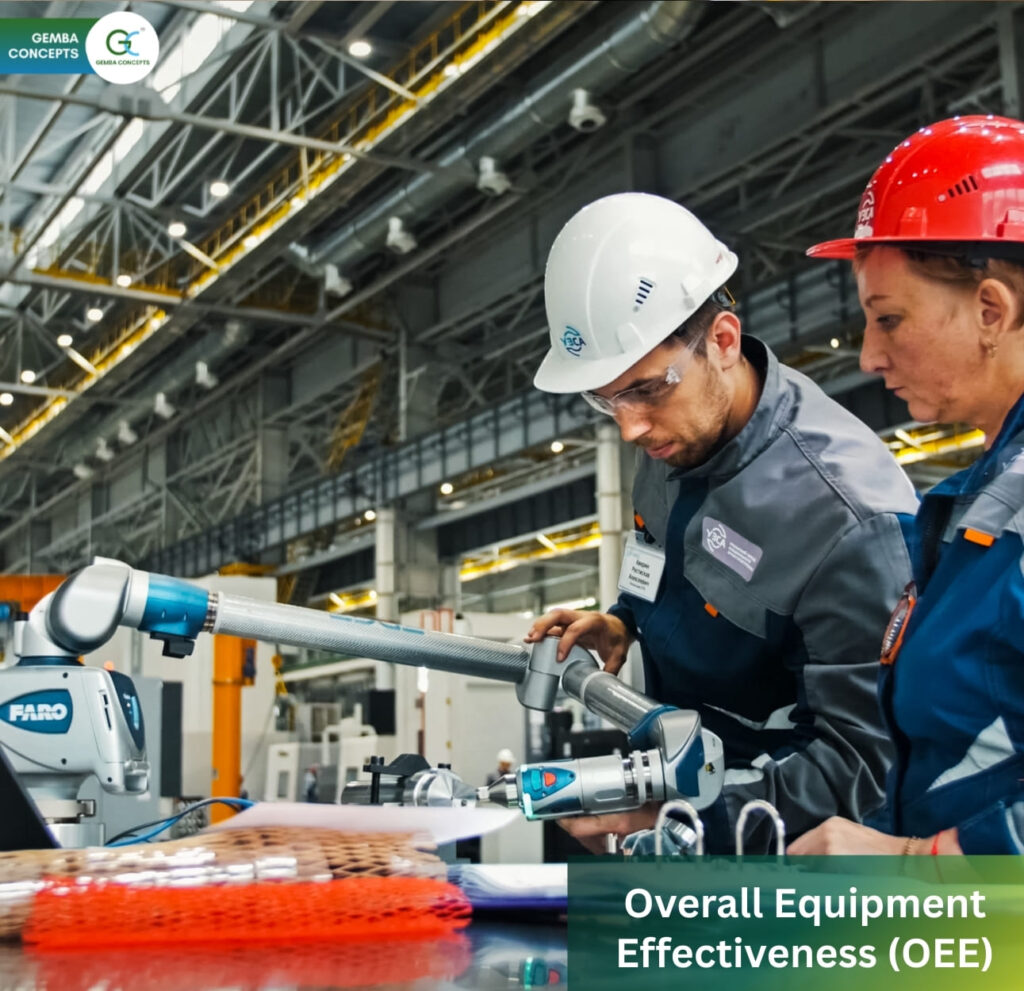
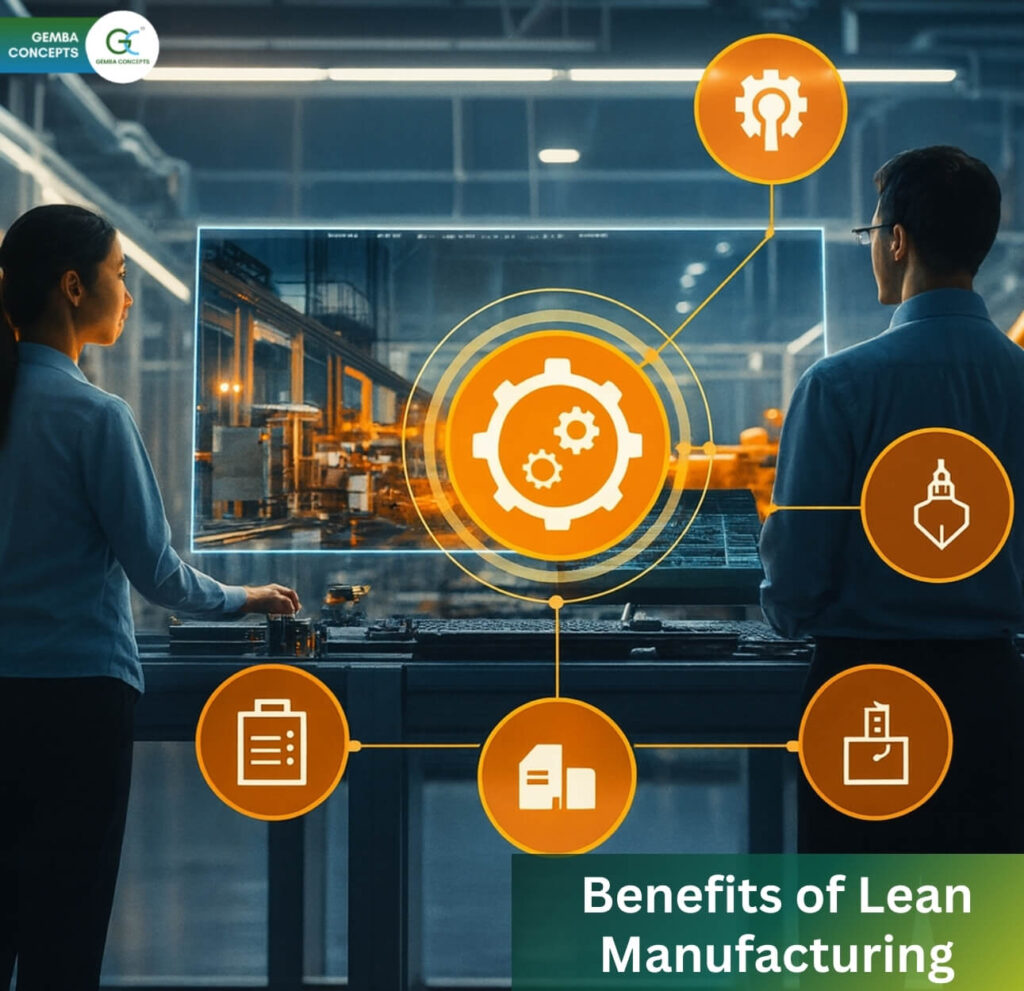
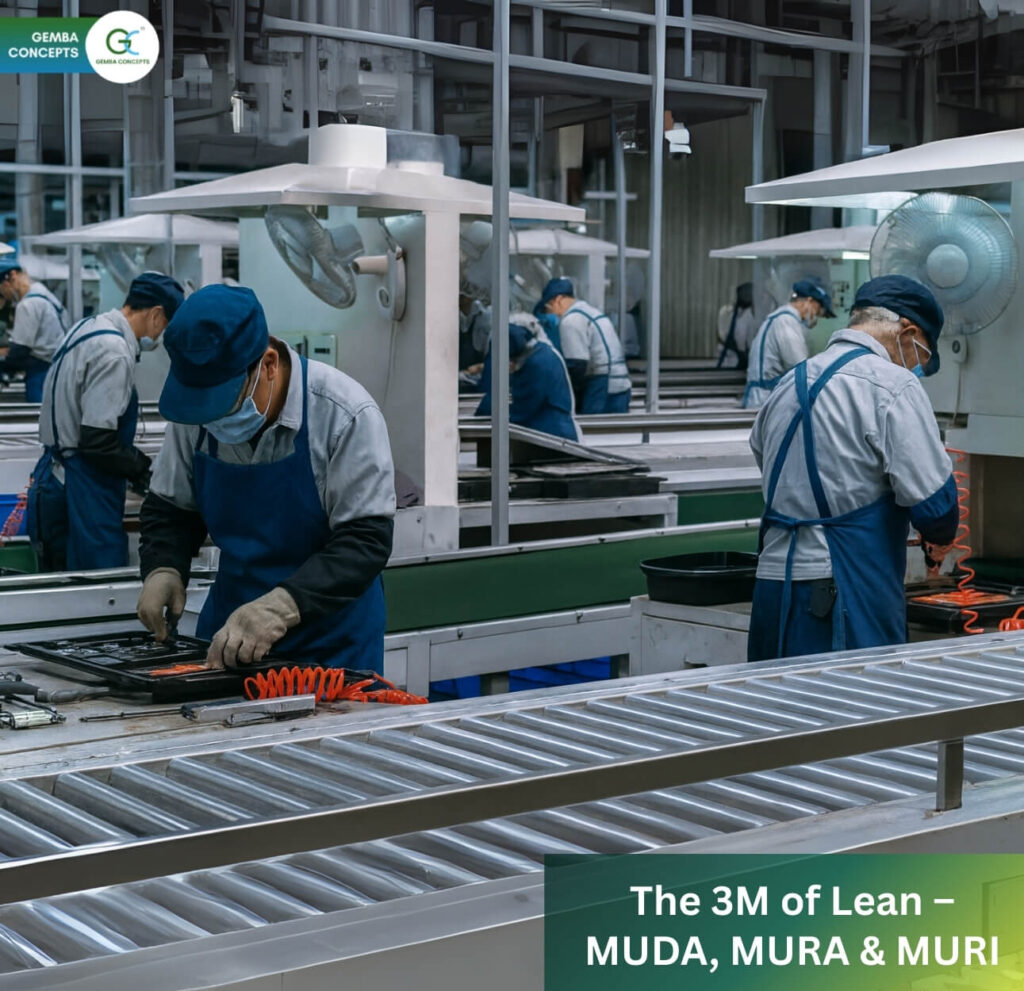
Gemba Concepts

OEE & Six Big Losses of OEE

What is OEE?

Overall equipment effectiveness (OEE) is a term used to evaluate how efficiently a manufacturer’s operation is being used. In other words, overall equipment effectiveness helps you notice a problem in your operations, identify which percentage of manufacturing time is actually productive and fix it while giving you a standardized gauge for tracking progress. The goal for measuring your OEE is continuous improvement.

In the language of OEE that means 100% Quality (only Good Parts), 100% Performance (as fast as possible), and 100% Availability (no Stop Time)

Why OEE is an important KPI for manufacturing success?

OEE is a key KPI for efficiency tracking. The data provides complete details about productivity rate, which in turn helps in reducing downtime, waste etc.

While we have other KPIs like Overall Operations Effectiveness (OOE), Total Equipment Effective Performance (TEEP), measuring OEE is the most focused and measured KPI because it plays a critical role in identifying root cause issues and accelerating the productivity and RoI.

OEE benchmarks 

While setting OEE as a KPI for measuring equipment effectiveness is a great move but what do you measure against. You need a baseline right? This is where the OEE benchmark comes in.

  • 1. An OEE score of 100% stands for perfect production.
  • 2. An OEE score of 85% is considered as a world-class benchmark for discrete manufacturers with a little room for improvement.
  • 3. An OEE score of 60% is for discrete manufacturers means there is some room for improvement.

An OEE score of 40% is quite common among manufacturing companies that just start tracking and improving manufacturing performance. It is a low score and should be addressed quickly.

How to calculate OEE and factors contributing to it

As far as OEE is concerned, there are 3 factors that contribute to the OEE data: Availability, Performance and Quality.

OEE = Availability x Performance x Quality

What is Availability in OEE

It is all about the availability of the machine during a planned schedule. Availability of the machine helps in identifying the losses whenever there is a STOP time or changeover.

The STOP time can be planned or unplanned or changeover, it can impact the availability of the machine leading to produce less than expected.

While changeovers can’t be eliminated completely, reducing them is always viable to reduce availability loss.

Availability (%) = Run Time (operating time) /Net available time

*Operating Time = Net Available Time – Unplanned Downtime

* Net Available Time = Shift Length – Planned Downtime

What is Performance in OEE

Performance in OEE provides data on the speed which the machine performs against the desired speed. While the ideal machine running time may be of a certain capacity, real-time running time might be relatively slower.

This can be due to minor stops, idle time or reduced speed.

Addressing these challenges will help improve the speed on the work centre and reduce performance loss.

This is how Performance is calculated.

  • Producing product within a stipulated time – Performance
Performance = (Ideal Cycle Time × Total Count) / Run Time

What is Quality in OEE

Quality in OEE represents the number of goods produced without any defect. If you’ve 100% of goods produced without any defect, then the work centre is performing phenomenally. However, this rarely happens. It is all about reducing the defective products and producing only good quality ones.

This is how Quality is calculated.

  • Produced in right way – Quality

Quality (%) = (Total Parts Produced – Total Scrap) / Total Parts Produced

OEE Calculation Example

OEE = Availability x Performance x Quality = 88 x 85 x 97 = 72.5%

………………………….

SIX BIG LOSSES OF OEE

One of the major goals of TPM (Total Productive Maintenance) and OEE (Overall Equipment Effectiveness) is to reduce and eliminate Six Big Losses. We have to capture the Six Big Losses to gain additional actionable insight to the OEE Factors of Availability, Performance, and Quality.

Classification of Six Big Losses

  1. 1. AVAILABILITY LOSS

a. Unplanned Stops – Equipment Failure

Equipment Failure accounts for any significant period of time in which equipment is scheduled for production but is not running due to a failure of some sort.

  • Examples:- Common reasons for Equipment Failure
  1. 1. Tooling failure
  2. 2. Breakdowns
  3. 3. Unplanned maintenance.

From the broader perspective of unplanned stops, other common reasons include lack of operators or materials

  • A good rule of thumb is to set that threshold based on your policy for tracking reasons. For example, your policy might be that any downtime longer than two minutes should have a reason associated with it – and thus shall be considered Equipment Failure.

b. Planned Stops – Setup & Adjustments

Setup and Adjustments accounts for any significant periods of time in which equipment is scheduled for production but is not running due to a changeover or other equipment adjustment.

  • Example:- Common reasons for Setup and Adjustments include
  1. 1. Setup
  2. 2. Changeovers
  3. 3. Major adjustments
  4. 4. Tooling adjustments.

From the broader perspective of planned stops, other common reasons include cleaning, warmup time, planned maintenance, and quality inspections.

  • The largest source of Setup and Adjustment time is typically changeovers (also referred to as make ready or setup), which can be addressed through a SMED (Single-Minute Exchange of Die) program.
  1. 2. PERFORMANCE LOSS

A. Small Stops – Idling & Minor Stops

Idling and Minor Stops accounts for time where the equipment stops for a short period of time (typically a minute or two) with the stop resolved by the operator.

  • Example:- Common reasons for Idling and Minor Stops include
  1. 1. Mis feeds
  2. 2. Material jams
  3. 3. Obstructed product flow
  4. 4. Incorrect settings
  5. 5. Misaligned or blocked sensors
  6. 6. Equipment design issues
  7. 7. Periodic quick cleaning.

B. Slow Cycles – Reduced Speed 

Reduced Speed accounts for time where equipment runs slower than the Ideal Cycle Time (the theoretical fastest possible time to manufacture one part).

  • Example:- Reduced speed include
  1. 1. Dirty or worn out equipment
  2. 2. Poor lubrication
  3. 3. Substandard materials
  4. 4. Poor environmental conditions
  5. 5. Operator inexperience
  6. 6. Start up
  7. 7. Shutdown.

3. QUALITY LOSS

A. Production Rejects – Process Defects

Process Defects account for defective parts produced during stable (steady-state) production. This includes scrapped parts as well as parts that can be reworked, since OEE measures quality from a First Pass Yield perspective.

  • Example :- Common reasons for process defects include
  1. 1. Incorrect equipment settings
  2. 2. operator or equipment handling errors etc.

B. Start-up Rejects – Reduced Yields 

Reduced Yield accounts for defective parts produced from start-up until stable (steady-state) production is reached. This includes scrapped parts as well as parts that can be reworked. Reduced Yield can occur after any equipment start-up, however, it is most commonly tracked after changeovers.

Example :- Common reasons for Reduced Yield includes

  1. 1. Suboptimal changeovers
  2. 2. Incorrect settings when a new part is run
  3. 3. Equipment that needs warmup cycles
  4. 4. Equipment that inherently creates waste after start-up (e.g., a web press).

BENEFITS TO USE SIX BIG LOSSES FRAMEWORK:

By focus on the Six Big Losses framework creates a concrete path to improve your OEE score.

1. Working to reduce Availability Loss in the form of Equipment Failures or Setups and Adjustments protects you against preventable unplanned stops or downtime, as well as minimizes any planned stops.

2. Addressing Performance Loss that results from Idling and Minor Stops, as well as Reduced Speed, prevents small stops and slow cycles from accumulating.

3. Finally, minimizing Quality Loss in the form of Process Defects and Reduced Yield reduces the number of unusable parts produced before and during steady-state production.


REFERENCES:

  1. 1. https://www.oee.com
  2. 2. https://www.nikunjbhoraniya.com/2020/02
  3. 3. https://www.oeesystems.com/knowledge
  4. 4. https://www.shutterstock.com
  5. 5. https://www.freepik.com
  6. 6. https://www.hakunamatatatech.com
4 3 votes
Article Rating
Subscribe
Notify of
guest
0 Comments
Inline Feedbacks
View all comments
0
Would love your thoughts, please comment.x
()
x